

It Wasn't the Economy
The S&P 500 fell 1.43% this week, but the drop wasn't due to evidence of a weakening economy. It came from a sharp selloff in semiconductor stocks. Several things fed the decline at once: a reversal of the momentum trade that had carried chip stocks for most of the year, a new AI model out of China that undercut the assumption that only massive U.S. infrastructure spending could produce frontier-level AI, and a broader reassessment of whether current valuations in the sector can be justified by what AI spending actually returns. Oil prices also jumped this week, tied to renewed fighting between the U.S. and Iran. On the other hand, there were bright spots: June inflation came in better than expected, and several large banks reported strong quarterly earnings.
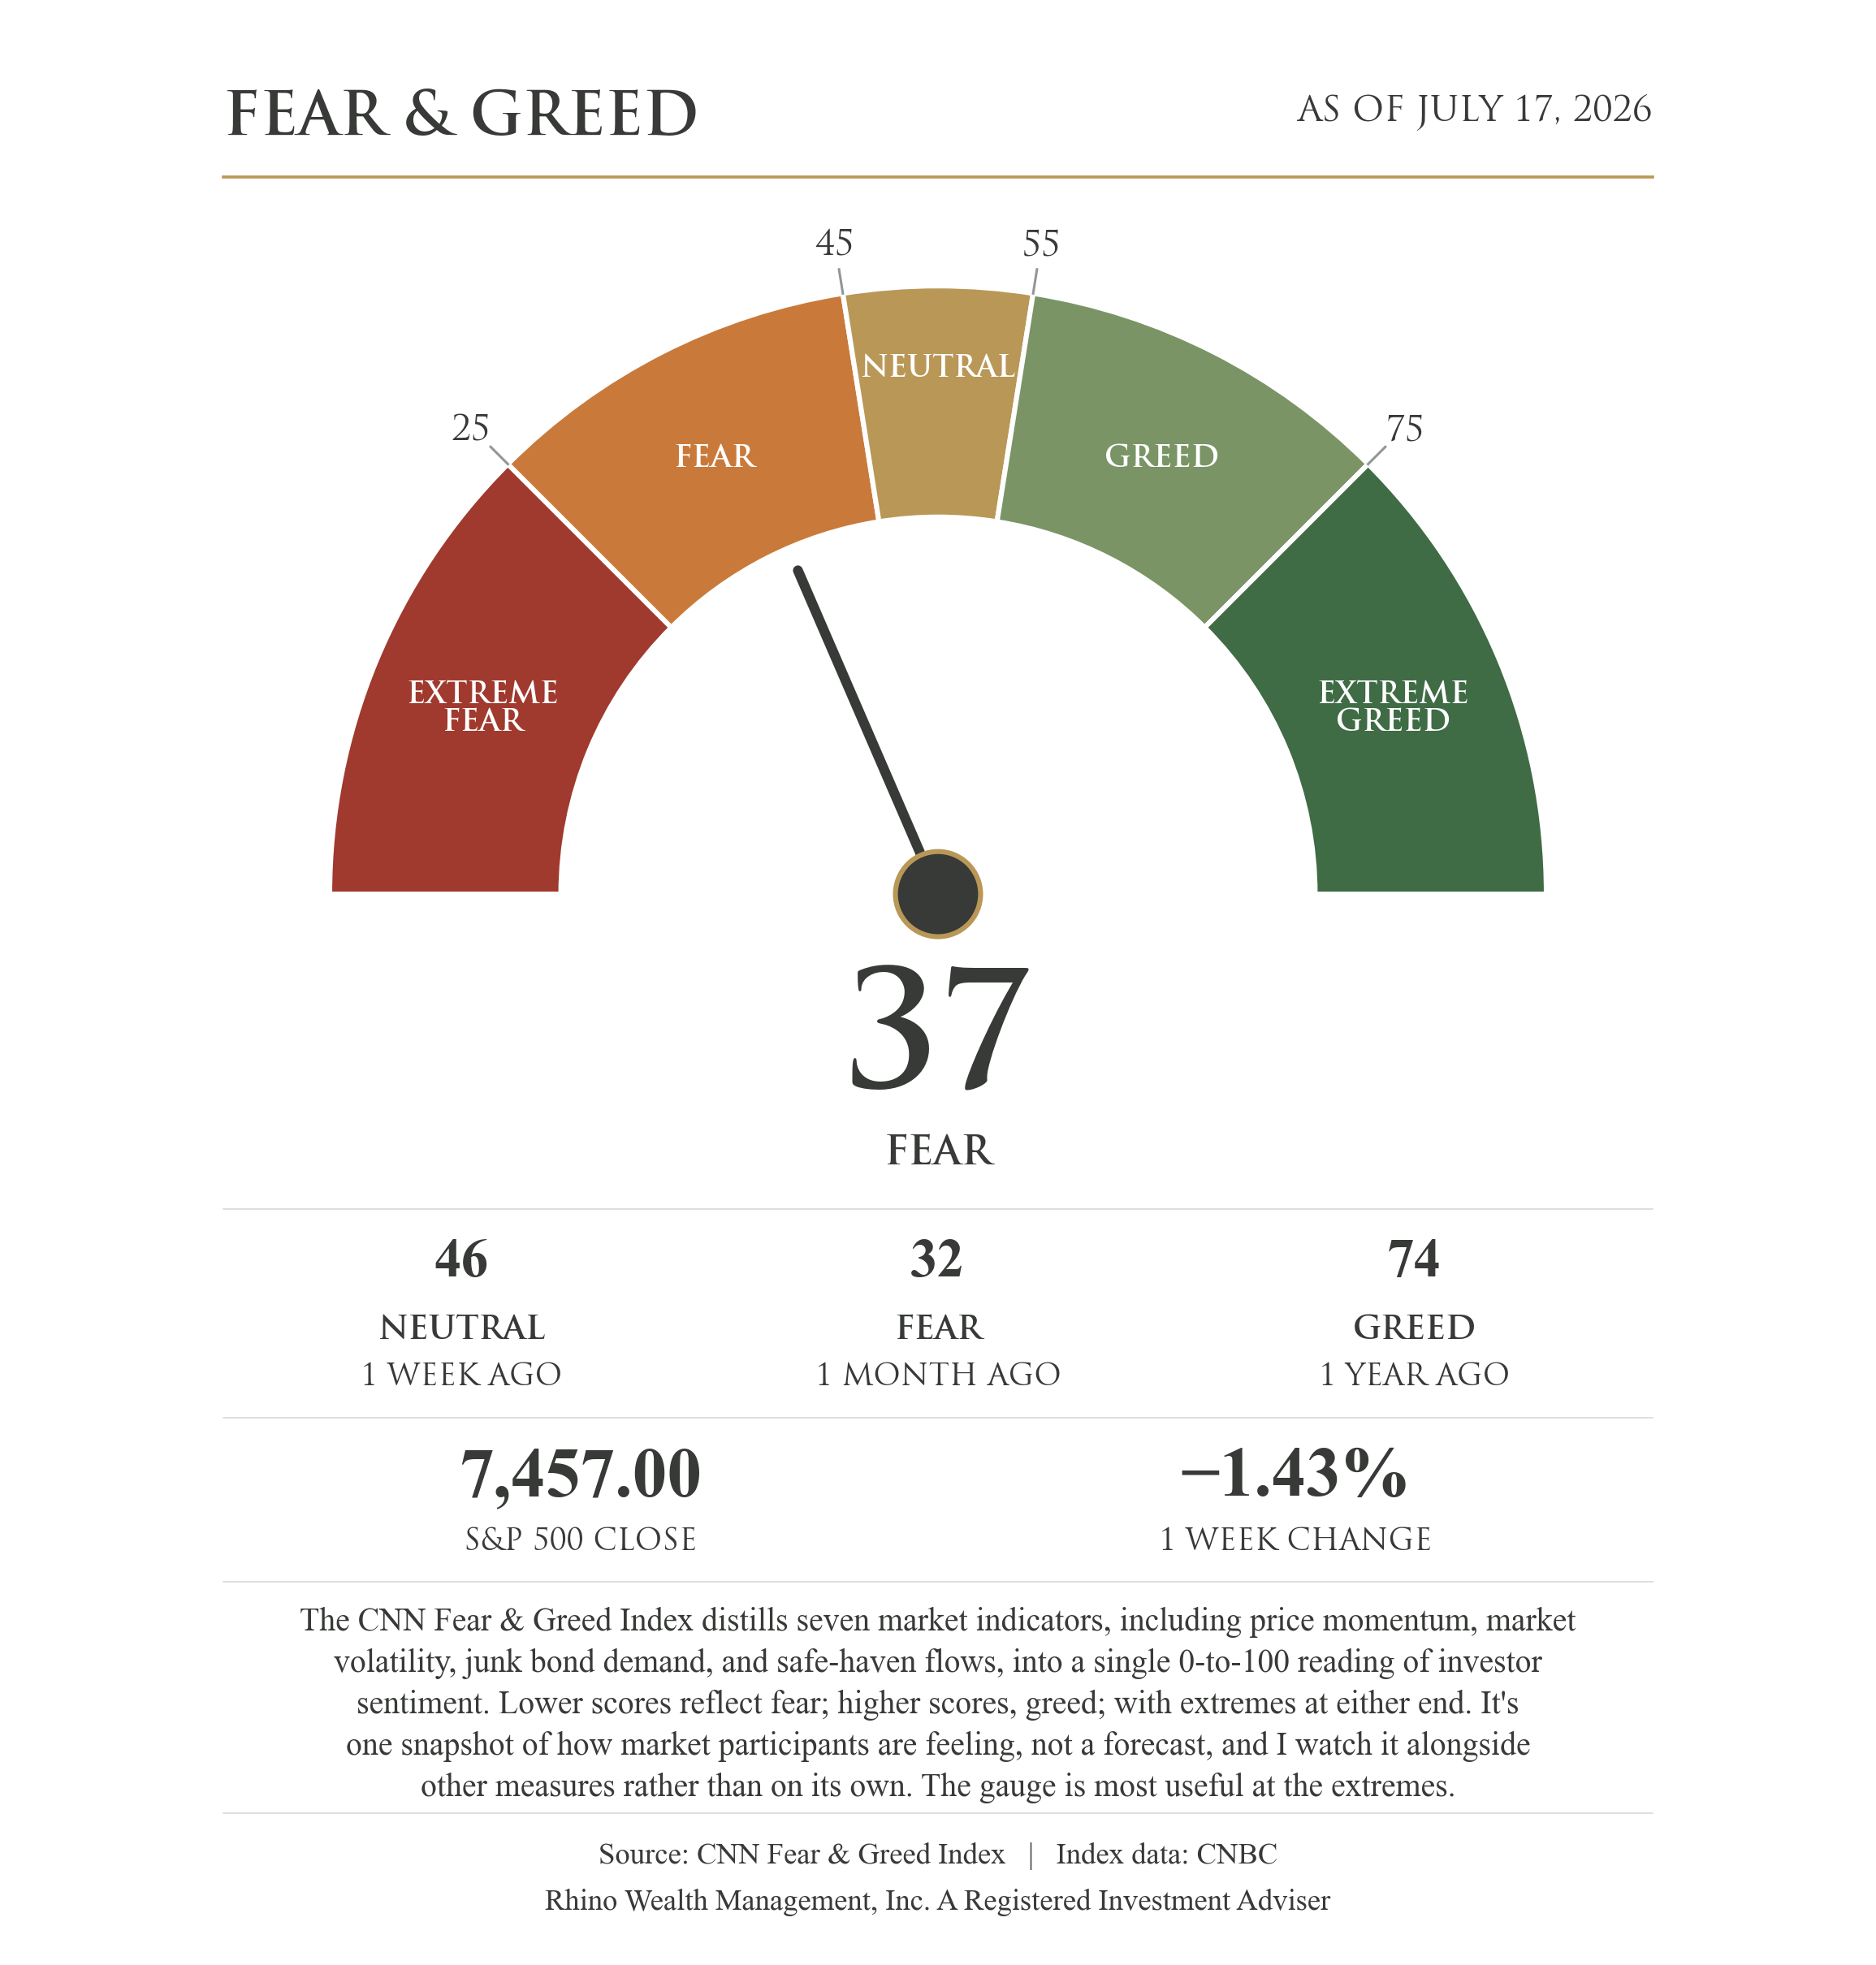
The Philadelphia Semiconductor Index tracks the largest chipmakers. It continued to slide this week, down 20% from its late-June high. Taiwan Semiconductor reported a 77% jump in quarterly profit and raised its spending plans for the year, and its shares fell anyway. Its revenue, though, is another company's spending. Investors have started to question whether AI spending will pay off.
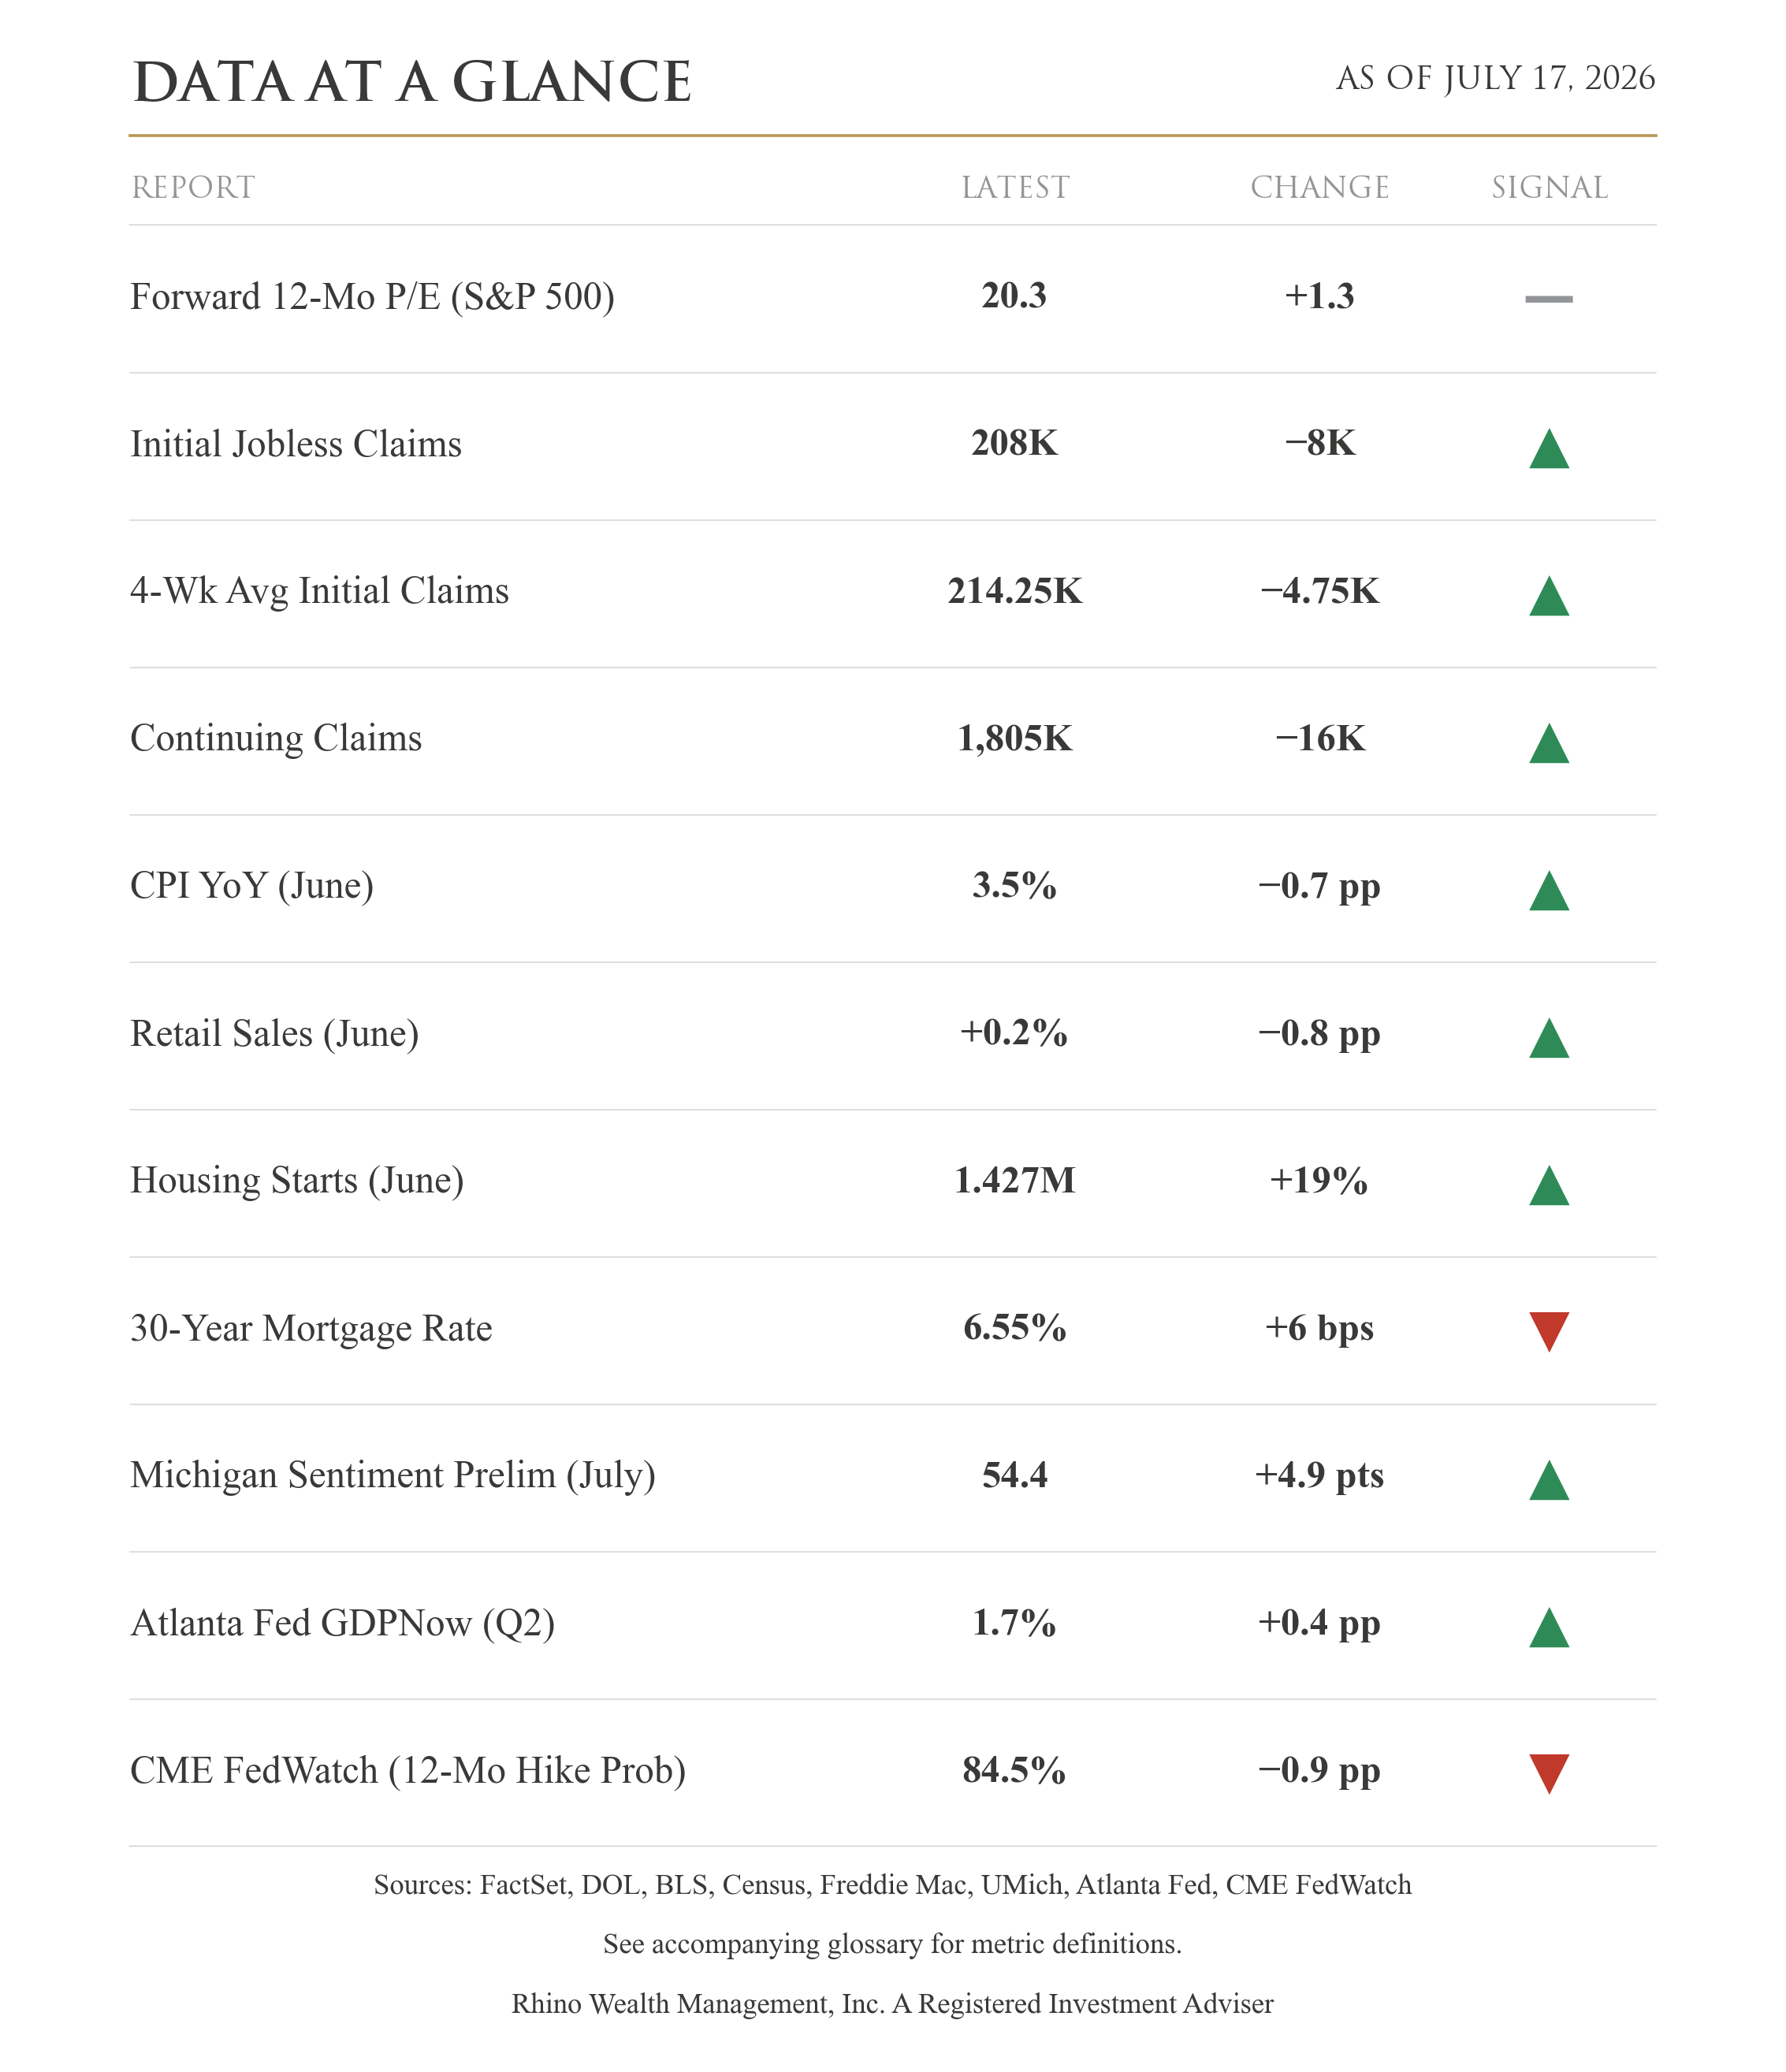
Inflation came in better than expected in June. Consumer prices rose 3.5% over the past year, down from an annual rate of 4.2% in May. Falling gas prices drove most of that improvement, but core prices cooled too, slowing to 2.6% from 2.9%. That energy relief is already reversing. Oil jumped roughly 12% this week to over $80 a barrel as the U.S.-Iran fighting picked back up, and higher energy costs will feed straight back into inflation. For the Fed, a soft June reading reduces the pressure for another rate hike.
New home construction jumped 19% in June. That sounds good, but the entire gain came from apartments and other multifamily buildings. Single-family homes, the kind most people buy, fell for the third month in a row, and single-family permits dropped to their lowest level in ten months. The 30-year mortgage rate climbed to 6.55% this week, and the affordability squeeze that has frozen much of the market hasn't eased. The 19% headline doesn't reflect what most people picture when they think of new home construction.
What I'm watching from here: Iran is the variable that moves everything else. As long as the fighting threatens the Strait of Hormuz, the passage for roughly a fifth of the world's oil, energy prices and inflation stay tied to the next headline out of the Middle East. Next week brings a wave of earnings from big technology companies. Our ETF scoring system has been downgrading the technology sector for weeks, effectively reducing portfolio risk. We'll know soon whether that trend continues or reverses on strong sector earnings.
Glossary of Terms
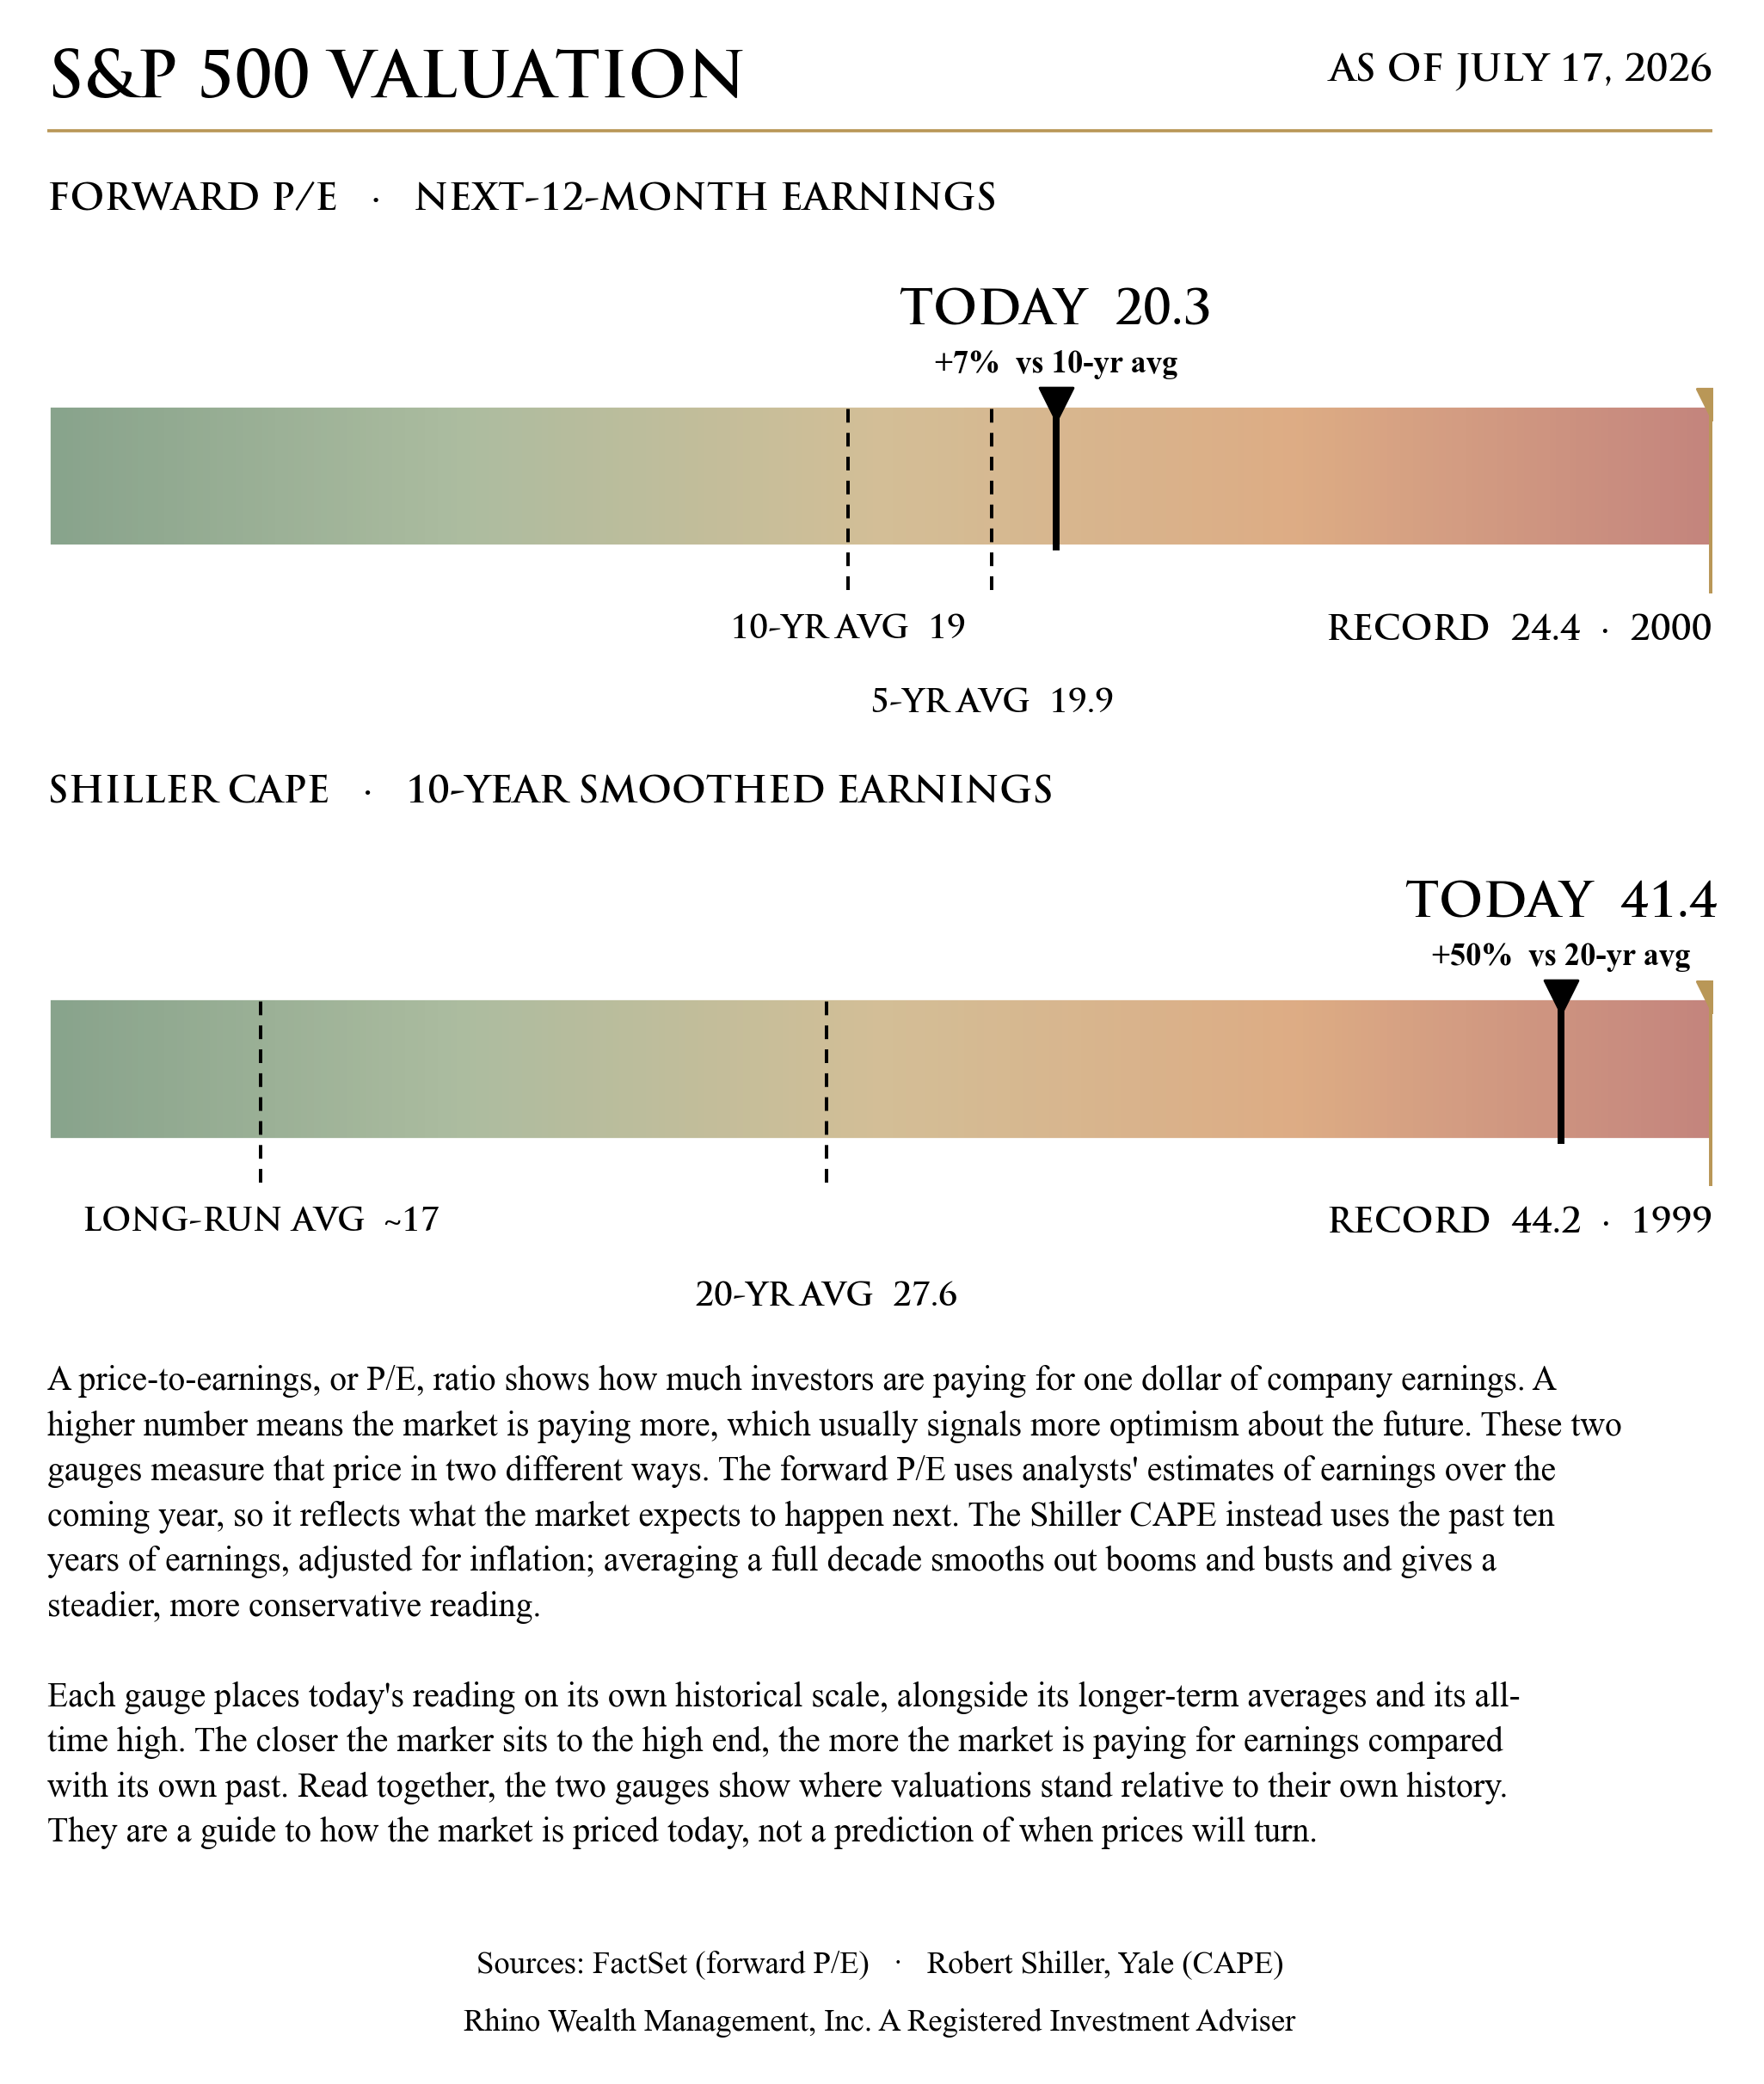
Forward 12-Month P/E (S&P 500) — Compares the S&P 500's current price to the earnings analysts expect its companies to produce over the next 12 months. It's a quick gauge of how expensive the stock market is: a higher number means investors are paying more for each dollar of expected profit. (Source: FactSet)
Initial Jobless Claims — The number of people who filed for unemployment benefits for the first time last week. A rising figure can be an early sign the job market is weakening; a falling one suggests layoffs are easing. (Source: U.S. Department of Labor)
4-Week Average Initial Claims — The average of initial jobless claims over the past four weeks. Averaging smooths out week-to-week noise to show the underlying trend in layoffs. (Source: U.S. Department of Labor)
Continuing Claims — The number of people still receiving unemployment benefits after their first week. It reflects how easily laid-off workers are finding new jobs — a rising number means people are staying unemployed longer. (Source: U.S. Department of Labor)
CPI YoY (Consumer Price Index, June) — Measures how much a typical basket of consumer goods and services costs today versus a year ago — the headline gauge of inflation. It matters because it shapes household budgets and the Federal Reserve's interest-rate decisions. (Source: Bureau of Labor Statistics)
Retail Sales (June) — The month-over-month change in total sales at U.S. retailers. Because consumer spending drives most of the economy, it's a timely read on household demand. (Source: U.S. Census Bureau)
Housing Starts (June) — The number of new residential construction projects that began during the month. It signals builder confidence and feeds through to jobs, materials, and the broader economy. (Source: U.S. Census Bureau)
30-Year Mortgage Rate — The average interest rate on a 30-year fixed home loan. It directly affects housing affordability and the monthly payment a buyer faces. (Source: Freddie Mac)
Michigan Consumer Sentiment, Preliminary (July) — A survey-based index of how optimistic households feel about their finances and the economy. Confident consumers tend to spend more, so it offers a forward-looking read on demand. (Source: University of Michigan)
Atlanta Fed GDPNow (Q2) — A running, real-time estimate of how fast the economy (GDP) is growing this quarter, updated as new data arrives. It is a model-based nowcast, not an official government figure. (Source: Federal Reserve Bank of Atlanta)
CME FedWatch (12-Month Hike Probability) — The market-implied probability, drawn from fed funds futures, that the Federal Reserve will have raised interest rates at least once over the next 12 months. It shows where traders think rates are headed. (Source: CME FedWatch Tool)
Disclosure:
This material is provided by Todd Van Der Meid, MBA, CFP®, through Rhino Wealth Management, Inc., a Registered Investment Adviser, solely for informational purposes. It is not intended as investment, tax, legal, or accounting advice. Investors should consult qualified professionals before making financial decisions.
Opinions expressed herein are general in nature and not tailored to individual circumstances. Investment strategies discussed may not be suitable for every investor. All investments carry risk, including possible loss of principal, and past performance does not guarantee future results. No investment strategy or risk management technique ensures profit or eliminates risk in all market conditions.
Investments in foreign or emerging markets involve additional risk, such as currency fluctuations, geopolitical instability, and varying accounting standards. Sector-specific investments can be more volatile due to their concentrated nature. References to indexes are for illustrative purposes; indexes are unmanaged, cannot be invested into directly, and their performance does not reflect fees, expenses, or sales charges. Index performance is not indicative of specific investment performance.
Economic forecasts and forward-looking statements reflect current views and assumptions and are subject to change. Actual results may vary materially due to market or other conditions. There is no obligation to update forward-looking information.
Information presented herein comes from reliable third-party sources but is not guaranteed for accuracy or completeness. Rhino Wealth Management, Inc. disclaims liability for errors or omissions. Portions of this content may be generated using advanced analytical tools, including artificial intelligence, and all such content has been reviewed and validated by Todd Van Der Meid, MBA, CFP®, using proprietary quality-control measures. Rhino Wealth Management, Inc. does not directly hold securities; however, securities mentioned may be included within recommended portfolio models or held by clients. Please refer to our Form ADV for additional details regarding potential conflicts of interest.