

The Market's Worst Month Is Here
Welcome to September, the only month of the year that has historically averaged a negative return for the S&P 500. I don't have a crystal ball. The point isn't to tell you to take any action. It's to let you know that increased volatility should be expected, and a drawdown at some point ahead of the midterm elections shouldn't come as a surprise.
The calendar is busy. Midterm elections are two months out, and markets tend to get choppy heading into them. The ceasefire with Iran expired in mid-August, the shooting started again over the weekend, and oil is back near $90 a barrel. On top of that, the Fed meets September 15 and 16, and for the first time in years the debate is about a hike, not a cut. What I'm watching is Friday's jobs report and the inflation numbers that follow, because they'll decide how much pressure the Fed is under when it sits down. That meeting could be a pivot point for markets, one way or the other.
Below is the valuation chart I've been including in the weekly emails. It usually gets a quick glance, so this time I want to walk through what each gauge actually measures and how I think about it for long-term planning.
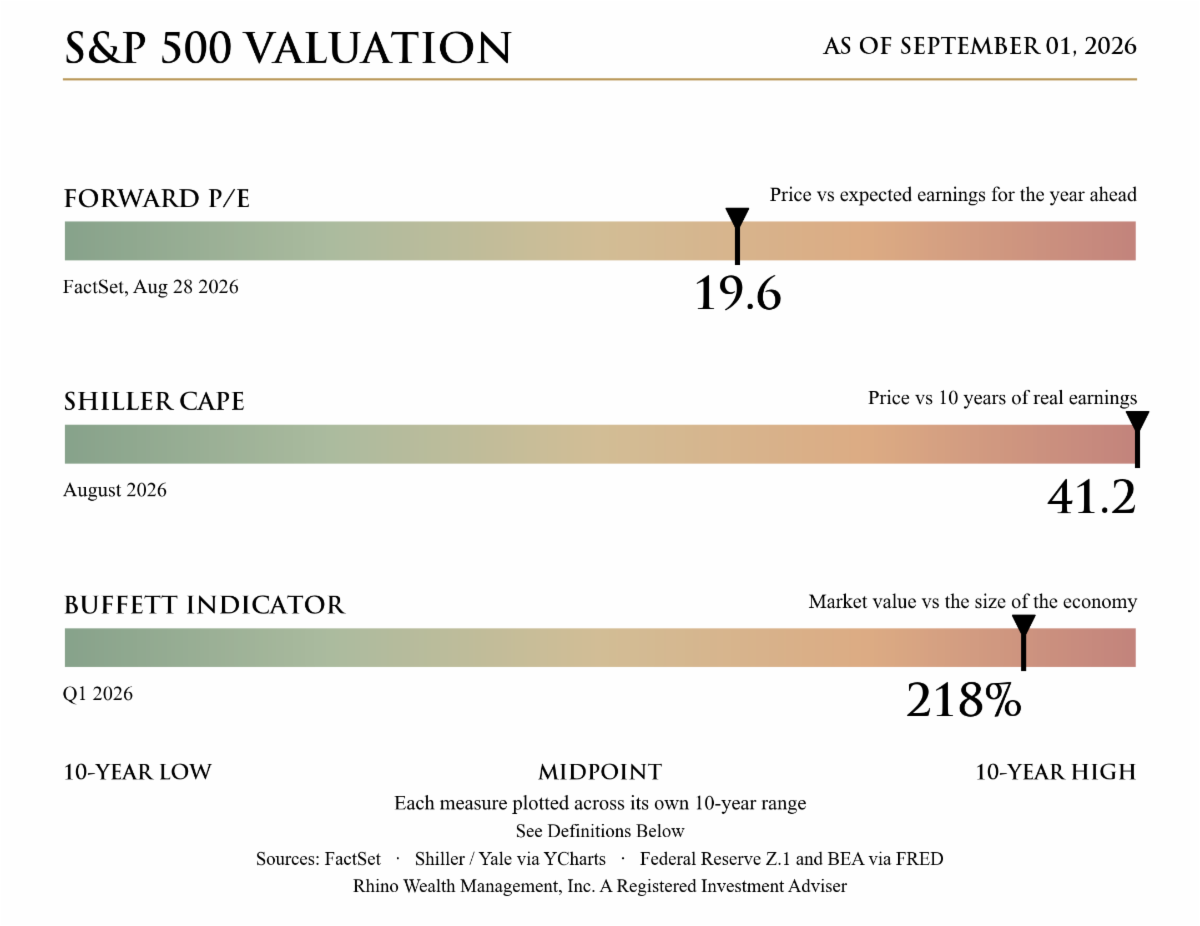
Forward P/E - The forward price-to-earnings ratio compares today's price with what analysts expect companies to earn over the coming year. Because it looks forward rather than backward, it's the most dynamic of the common valuation measures, and the one that depends most on the forecasts being right. If economic events shift the earnings landscape for companies, the forward P/E can adjust quickly. Also, analysts are human and can simply be wrong in either direction.
Shiller CAPE - The Shiller CAPE, developed by Yale economist and Nobel laureate Robert Shiller, compares today's price with the past ten years of company earnings, adjusted for inflation. Averaging a full decade smooths out booms and busts, so one strong or weak year can't distort the picture. The tradeoff is that it looks backward and reacts slowly. Shiller uses market prices and earnings going back to 1871. The message is reversion to the mean. After a stretch of outsized market returns that pushes valuation measures to extremes, a period of lower returns typically follows. This could also mean foreign and emerging markets outperform US markets over the next decade or more.
Buffett indicator - The Buffett indicator gets its name from Warren Buffett, who in 2001 called it "probably the best single measure of where valuations stand at any given moment." Buffett suggested there should be some relationship between the total value of the stock market and the US economy. Globalization has stretched that relationship: US companies now earn a meaningful share of their revenue overseas, so the market has grown disproportionately to the domestic economy. The gauge in the chart above is the traditional version: the US stock market compared with the US economy. A better measure might compare the total value of US companies with the size of the economy they actually sell into. Even so, the indicator's appeal is that it steps outside earnings entirely: it can't be flattered by an unusually good or bad year of profits. A higher reading means the market has grown large relative to the economy underneath it.
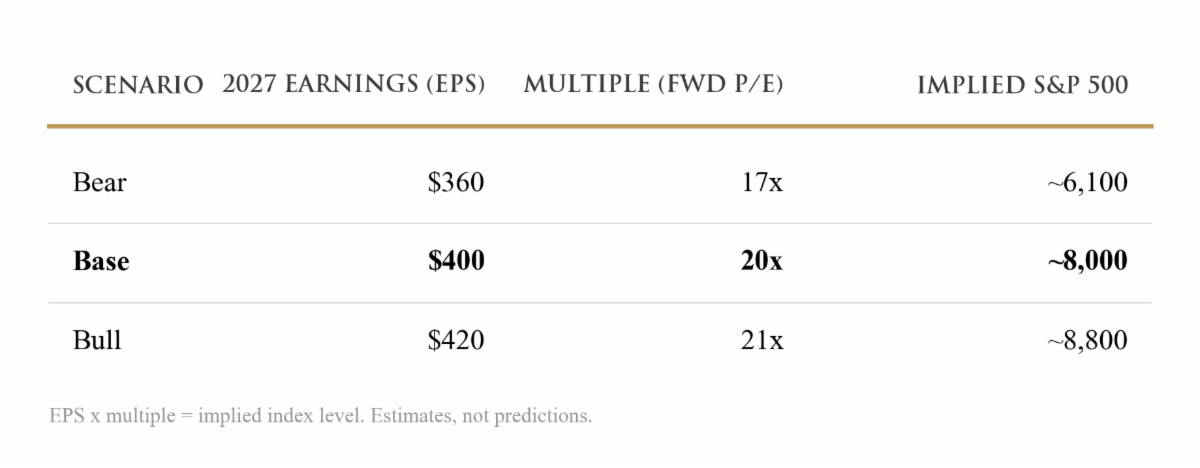
Here is the range of outcomes I think is reasonable from here, and why. Any market forecast comes down to two numbers: what companies earn, and the multiple investors will pay for those earnings (the forward P/E from the chart above). Wall Street currently expects S&P 500 companies to earn somewhere between $385 and $420 per share in 2027. The multiple is the bigger wildcard, because it moves with inflation, interest rates, and investor sentiment. Put the two together and you get the table below. In the bear case, earnings stall and nervous investors pay less per dollar of earnings. The base case has earnings coming in near expectations with the multiple holding around today's level. And if the AI spending boom keeps delivering, you get the bull case, where investors pay up for it. The base case lands a few percent above where the market already trades, which tells you the current price assumes things mostly go right. It doesn't mean stocks are stuck here. Markets always look ahead, so as 2028 earnings come into view, prices can still climb with them. The catch is that most of the return from here has to come from earnings growth, because there's little room left for the multiple to rise. The bear case is a decline of roughly 20% from here. Declines like that are a normal part of investing, and your long-term plan should be built with them in mind.
I'll include these and other gauges in the weekly emails so you can track the changes and stay informed. The portfolio models are managed based on market and economic data. When the data changes, the allocation process shifts with it. Please reach out if you have any questions.
Disclosure:
This material is provided by Todd Van Der Meid, MBA, CFP®, through Rhino Wealth Management, Inc., a Registered Investment Adviser, solely for informational purposes. It is not intended as investment, tax, legal, or accounting advice. Investors should consult qualified professionals before making financial decisions.
Opinions expressed herein are general in nature and not tailored to individual circumstances. Investment strategies discussed may not be suitable for every investor. All investments carry risk, including possible loss of principal, and past performance does not guarantee future results. No investment strategy or risk management technique ensures profit or eliminates risk in all market conditions.
Investments in foreign or emerging markets involve additional risk, such as currency fluctuations, geopolitical instability, and varying accounting standards. Sector-specific investments can be more volatile due to their concentrated nature. References to indexes are for illustrative purposes; indexes are unmanaged, cannot be invested into directly, and their performance does not reflect fees, expenses, or sales charges. Index performance is not indicative of specific investment performance.
Economic forecasts and forward-looking statements reflect current views and assumptions and are subject to change. Actual results may vary materially due to market or other conditions. There is no obligation to update forward-looking information.
Information presented herein comes from reliable third-party sources but is not guaranteed for accuracy or completeness. Rhino Wealth Management, Inc. disclaims liability for errors or omissions. Portions of this content may be generated using advanced analytical tools, including artificial intelligence, and all such content has been reviewed and validated by Todd Van Der Meid, MBA, CFP®, using proprietary quality-control measures. Rhino Wealth Management, Inc. does not directly hold securities; however, securities mentioned may be included within recommended portfolio models or held by clients. Please refer to our Form ADV for additional details regarding potential conflicts of interest.