
The Economy Feels Worse Than It Is
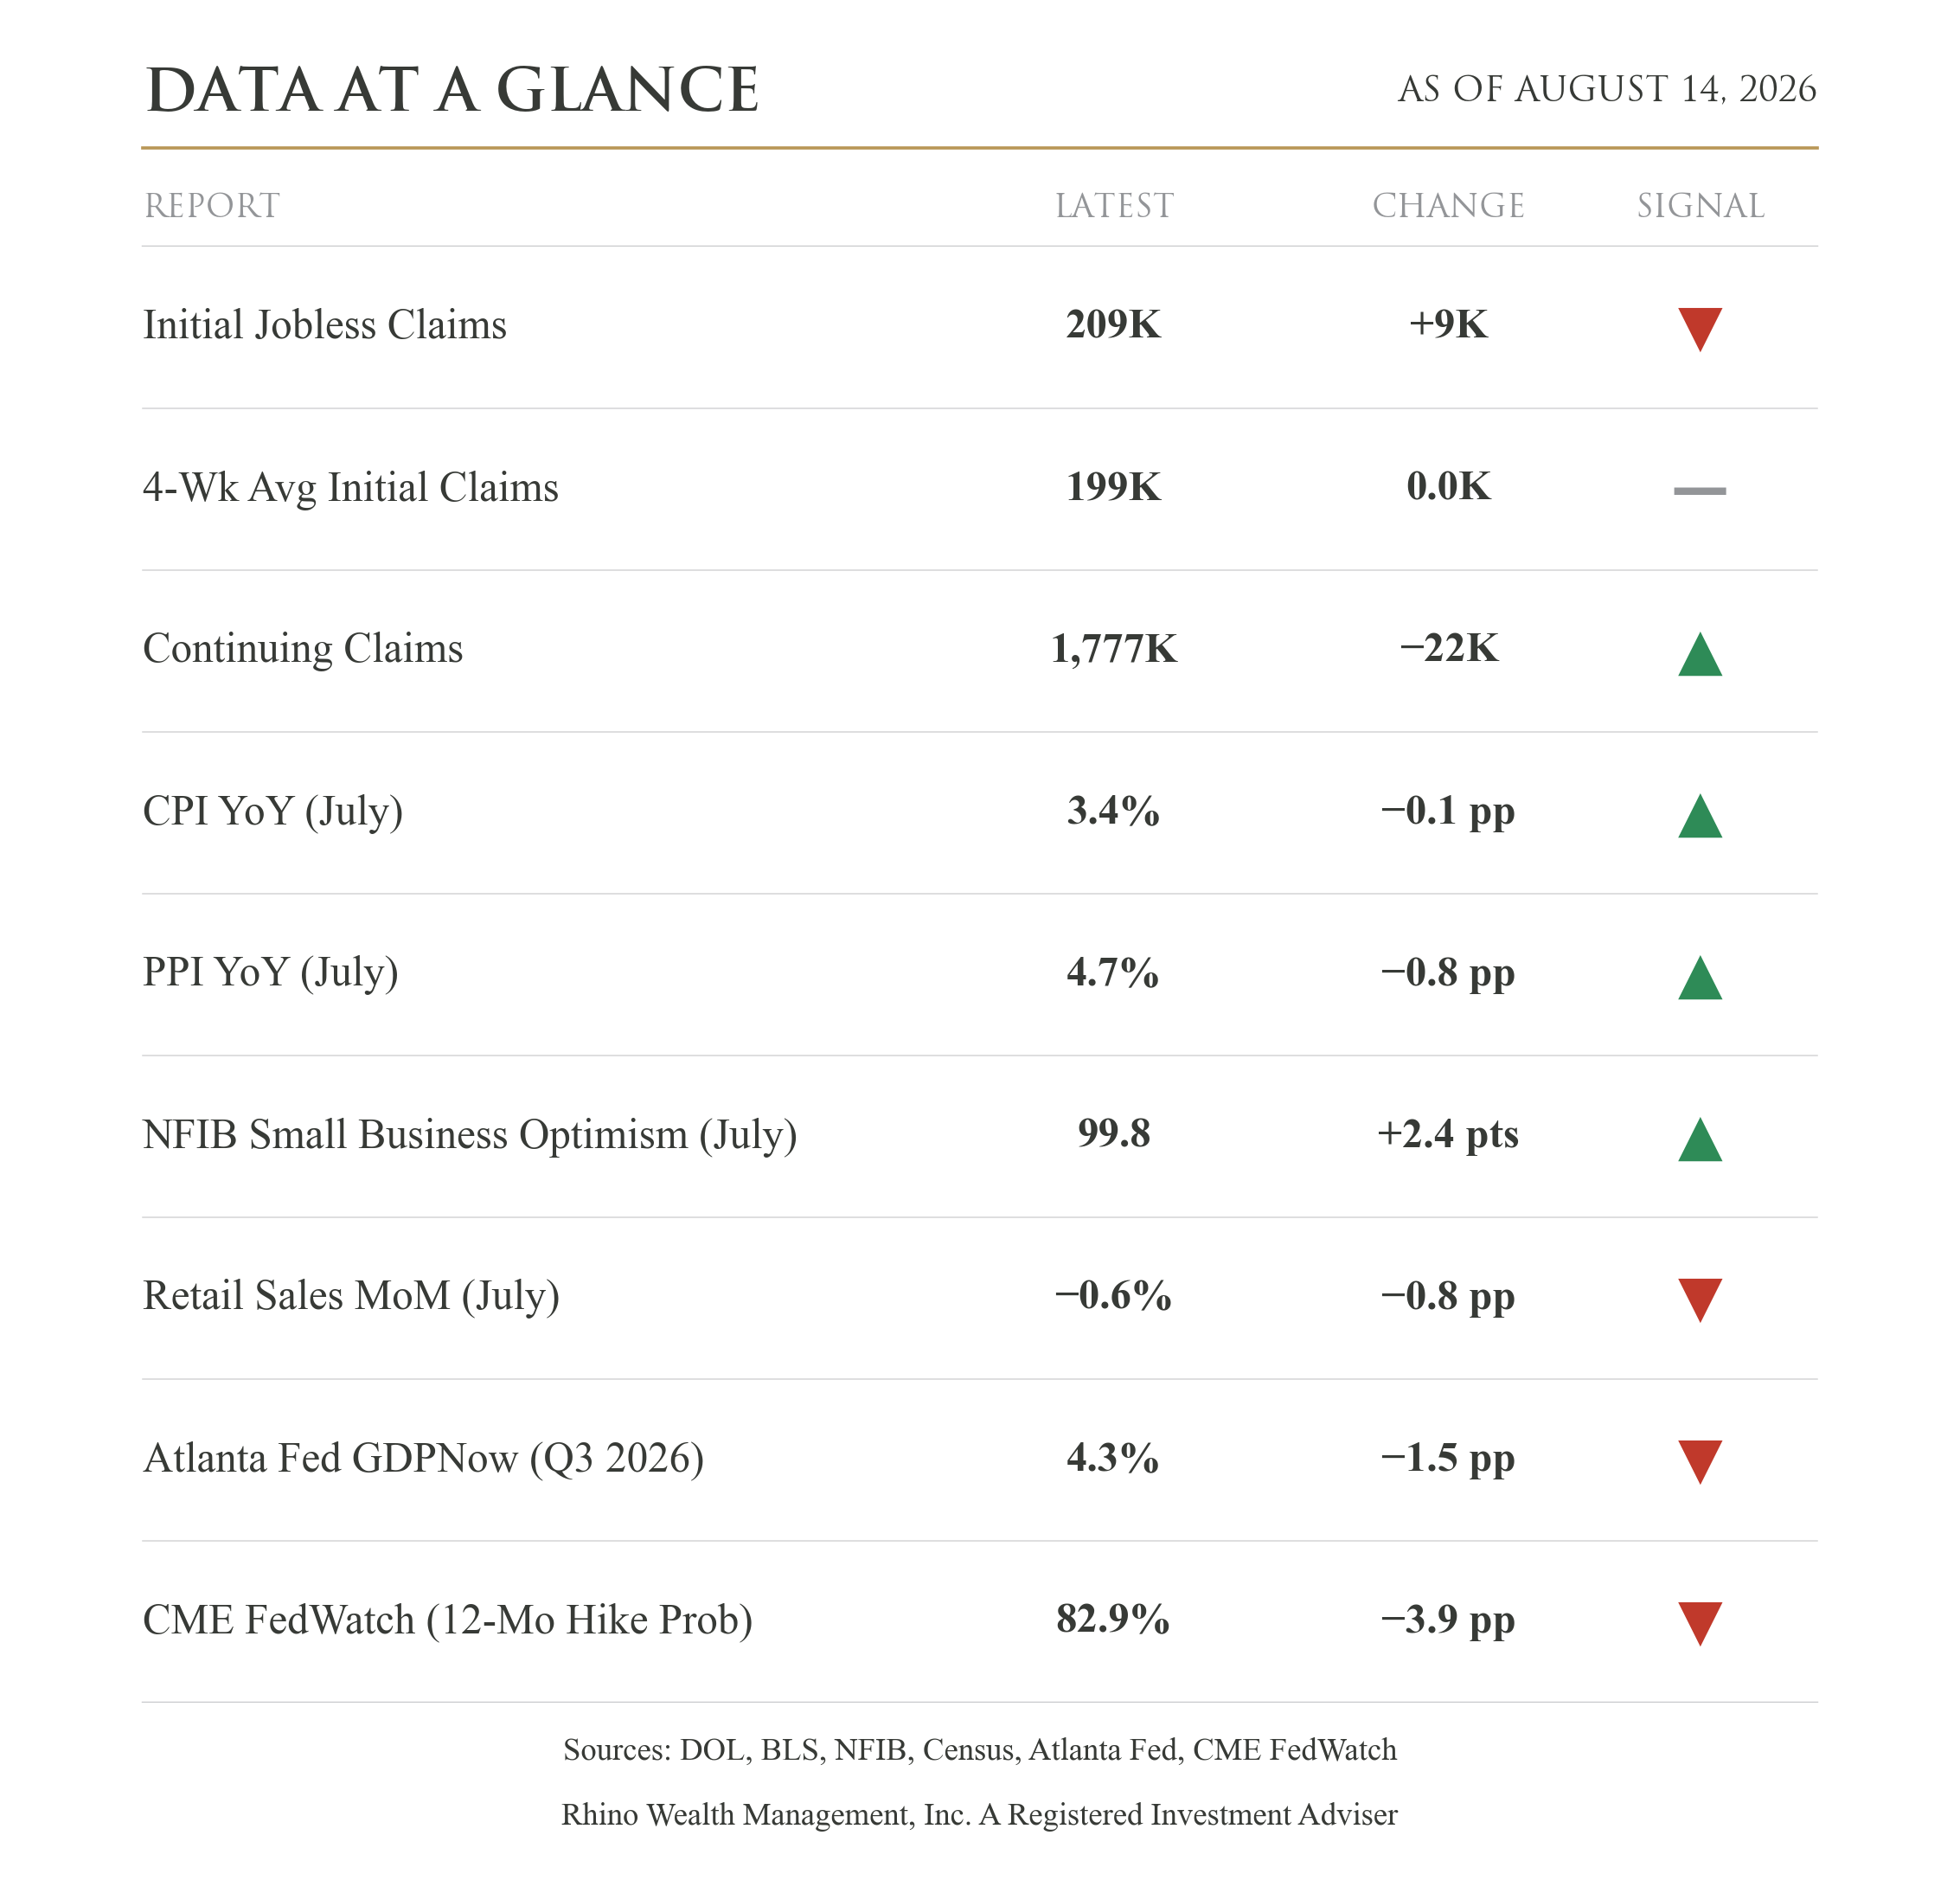
The S&P 500 finished the week up 0.36% to close at 7,785, after cooler-than-expected inflation data on Wednesday and Thursday reduced the odds of a Fed September rate hike.
The Consumer Price Index (CPI), which tracks what households pay, rose 3.4% over the past year, down from 3.5% in June. The Producer Price Index (PPI), which tracks what businesses pay before goods reach the shelf, came in softer than expected at 4.7%. Both readings pushed the market to a record close on Thursday and cut the odds of a September rate increase from roughly a coin flip to about one in three. Friday's retail sales report showed sales fell 0.6% in July, the largest monthly drop in more than a year, and the University of Michigan's survey showed consumer sentiment fell about 8% to its lowest reading since spring.
This week:
Why consumers feel worse than the economic data looks
Why I’d expect more market volatility over the coming months
What the allocation process is changing inside the portfolio models
In This Economy
All my life I’ve heard people say, “Well, in this economy.” What they are complaining about may change from season to season, but the refrain persists: “Well, in this economy.”
Right now, the surveys say people feel pretty lousy. The University of Michigan’s consumer sentiment index fell 8% in August to 51, and only 8% of consumers expect their income to grow faster than inflation over the next year.
Consumers’ pessimism isn’t showing up in their spending habits. Retail sales fell 0.6% in July but were still 5% higher than a year ago. The monthly decline was concentrated in a few places. Online sales fell 2.2% after Amazon moved Prime Day into June from July last year. Auto dealers fell 1.8%, and gas station sales fell 0.9% largely because gasoline prices fell 2.9% in July. Clothing sales rose 1.9% and restaurant sales rose 0.5%. Bank of America’s card data showed spending up 5% from a year earlier, and more households are paying their credit-card balances in full each month. None of that looks like a consumer who has stopped spending.
The rest of the backdrop is similar. Unemployment is 4.1%, which is low by historical standards, and the stock market is sitting near an all-time high. Inflation at 3.4% is still above target, and the fact that inflation has slowed does not make groceries, insurance, or housing cheaper. But we have also lived through much worse. Inflation peaked at 14.8% in March 1980, and the average 30-year mortgage rate reached 18.63% in October 1981. Those periods often look better in hindsight than they felt while people were living through them.
Billy Joel made that point in his 1983 song “Keeping the Faith”:
“You know the good ole days weren't always good / And tomorrow ain't as bad as it seems.”
Consumers have plenty to complain about, especially the cumulative effect of several years of higher prices. But the hard data do not look as bad as the sentiment surveys suggest. If households begin pulling back on spending or falling behind on their bills, that changes the picture. So far, it mostly hasn’t.
Priced for Good News
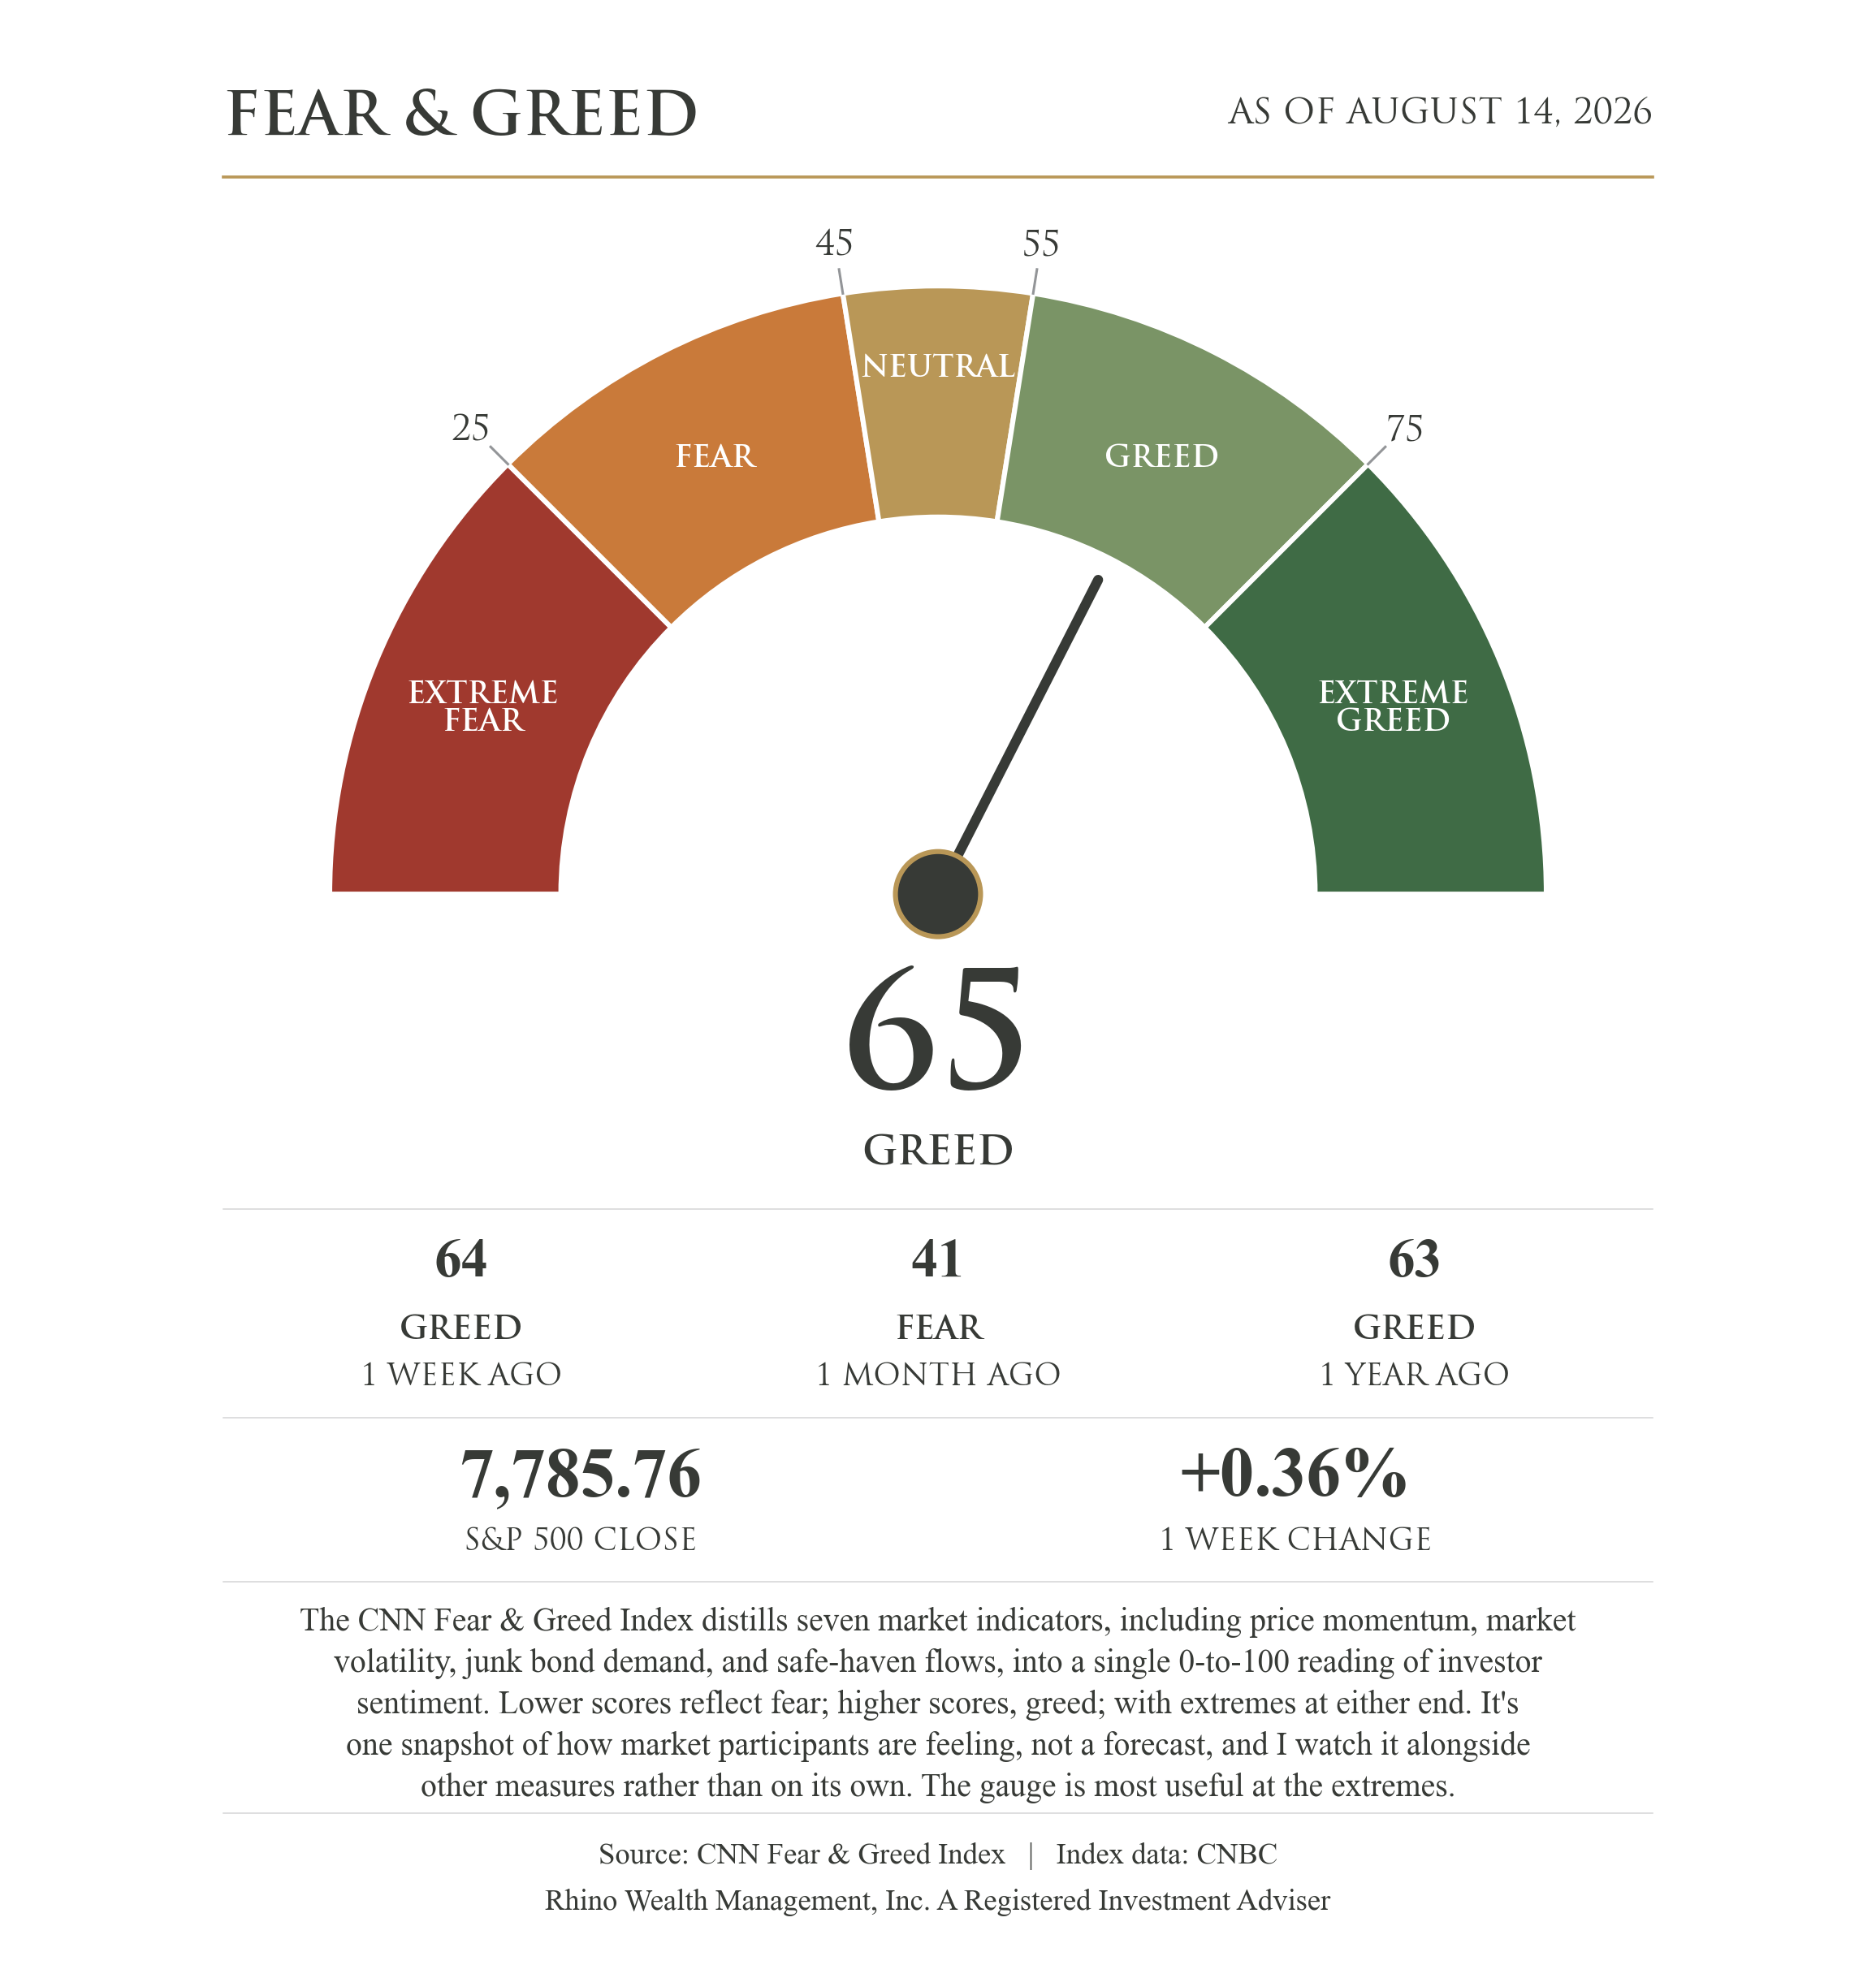
Consumer sentiment is lousy. Investor sentiment is not. The Fear & Greed Index sits at 65, in Greed territory and up from 41 a month ago. They are measuring different things. The University of Michigan’s consumer sentiment survey asks households how they feel about their finances and the economy; Fear & Greed looks at how investors are behaving in the market. Right now, investors are a lot more comfortable than consumers.
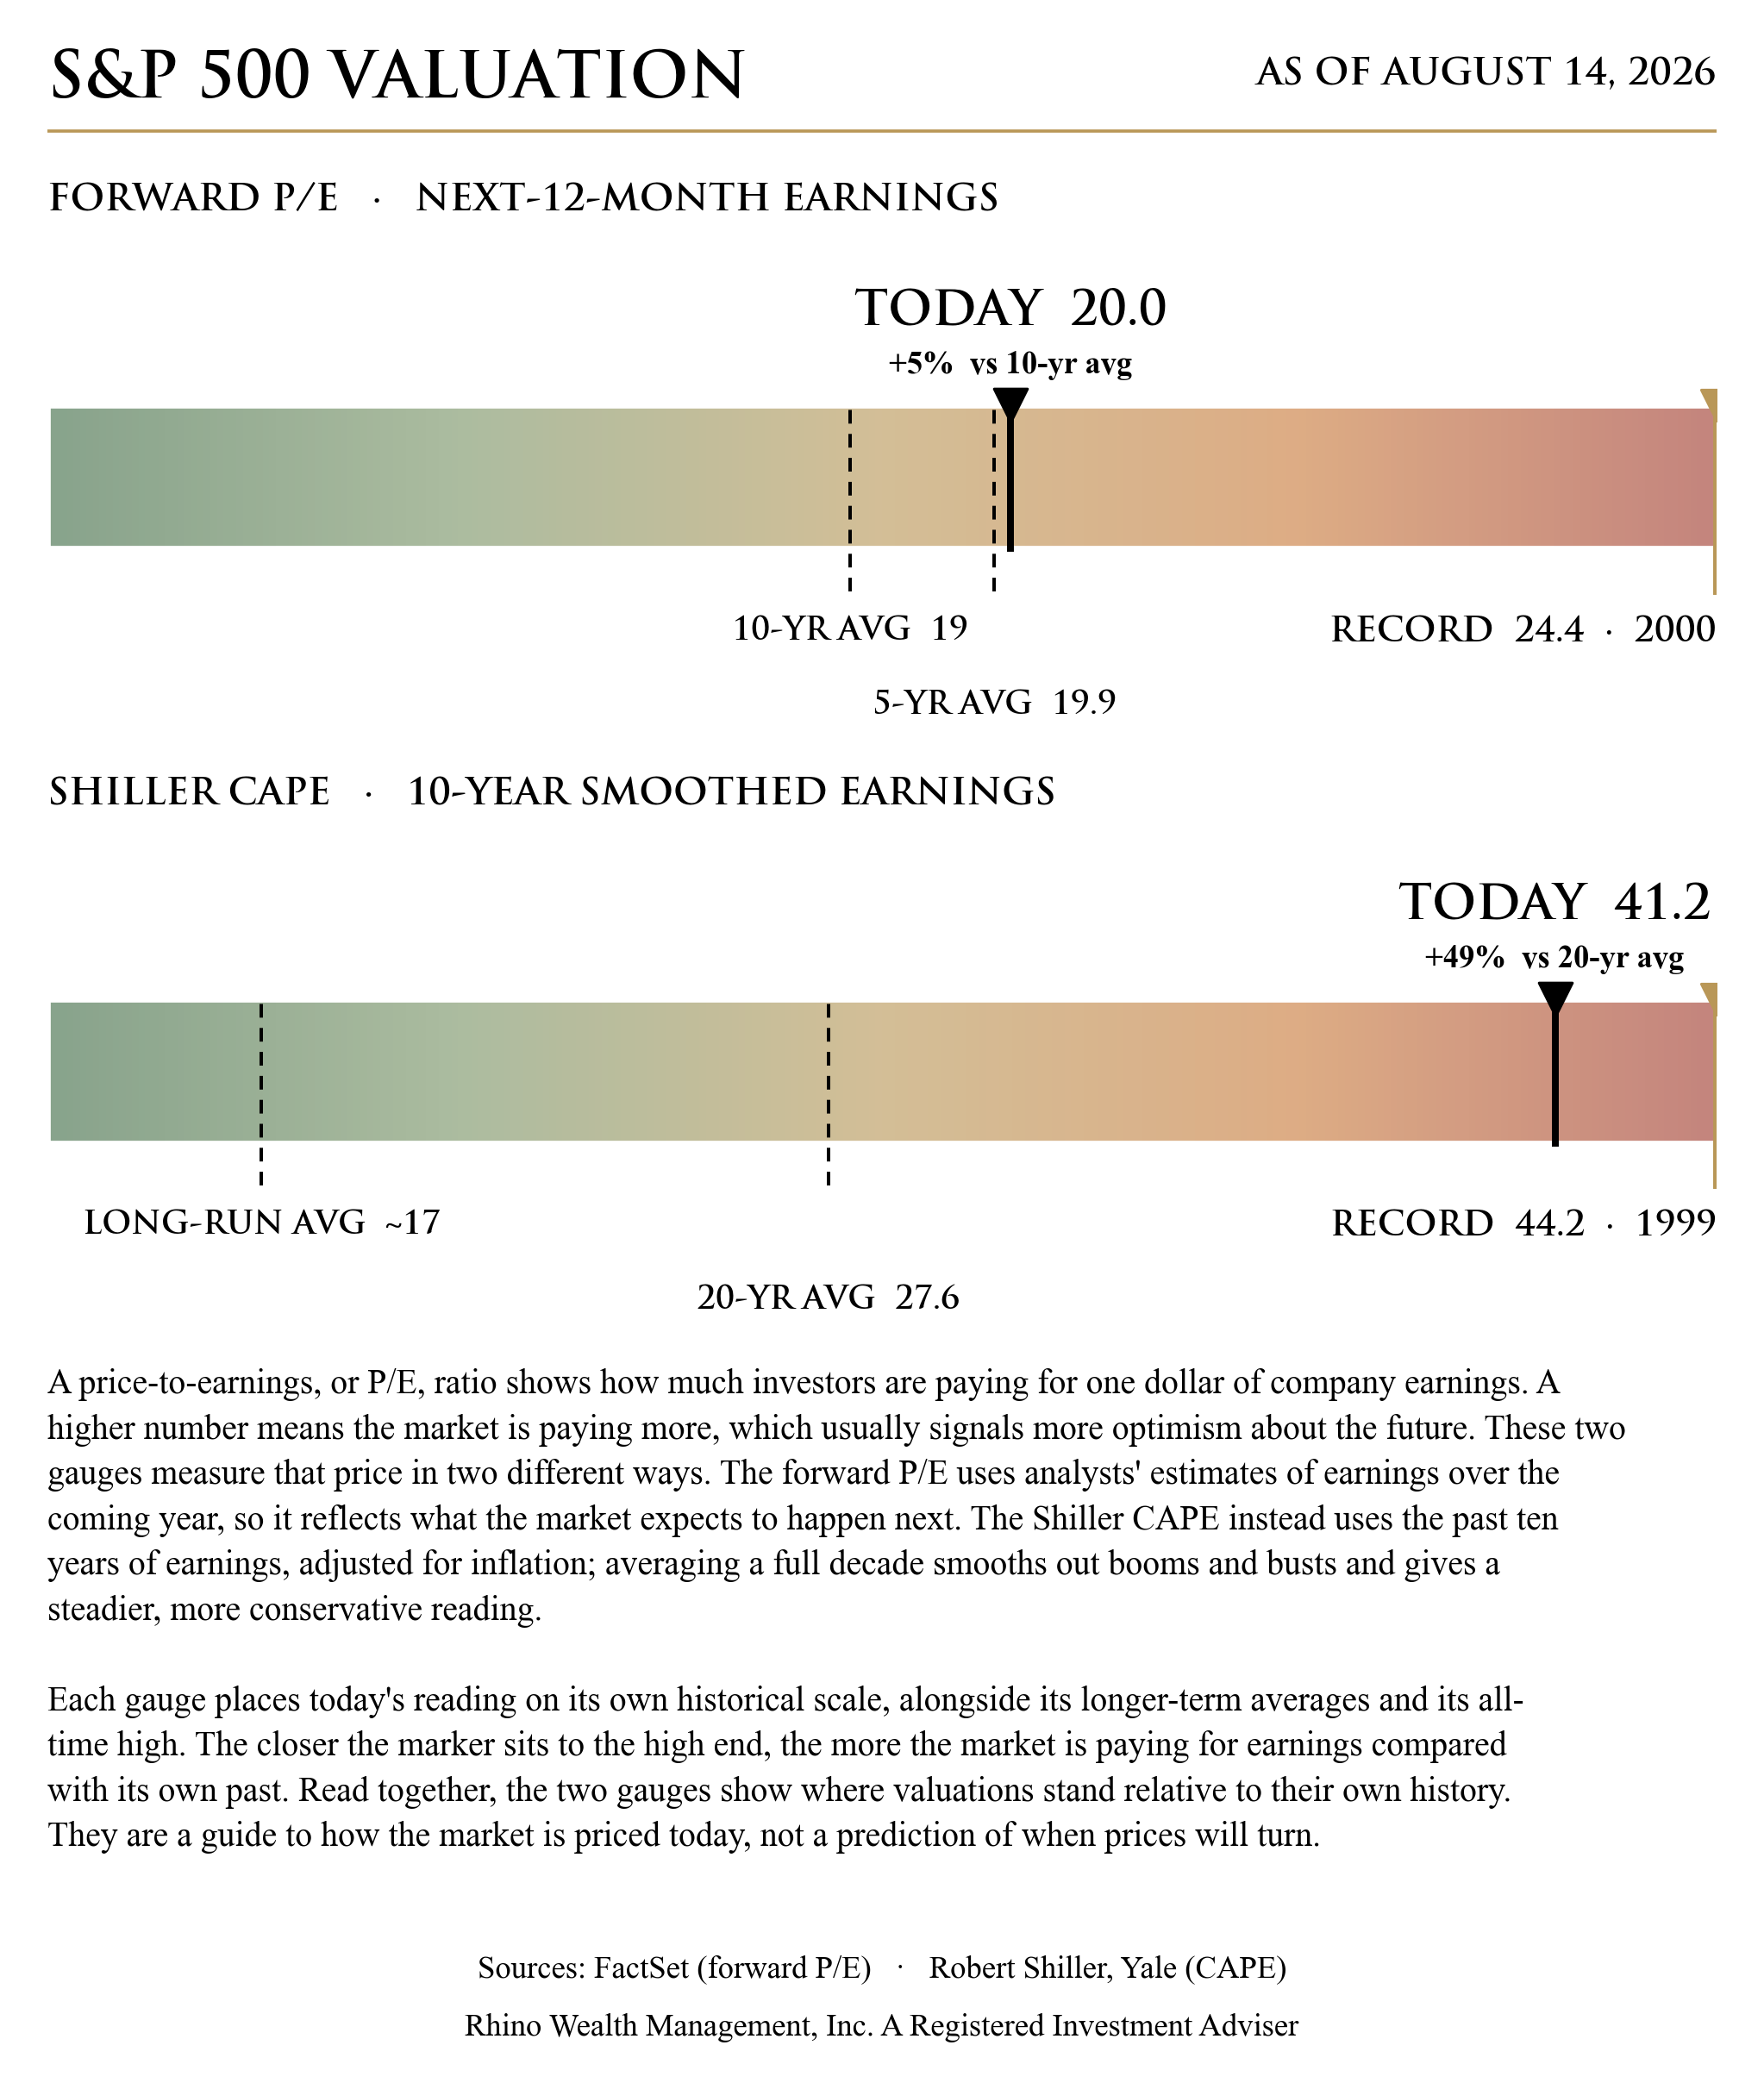
You can see some of that comfort in valuations. On next year's expected earnings, the S&P 500 trades at about 20 times, roughly 5% above its ten-year average. By that measure, the market is mildly expensive. The Shiller CAPE, which averages ten years of earnings to smooth out booms and busts, sits at 41.2, roughly 49% above its twenty-year average and within reach of its 1999 record. Valuation is a lousy timing tool, and expensive markets can stay expensive for a long time.
Now add the calendar. Going back to 1928, September is the only month of the year that has finished lower more often than higher, negative about 55% of the time. August ranks third. This is a historical rate, not a forecast. But put it next to a record-high market, a midterm election year, and two active wars, and I would rather you expect some volatility over the coming weeks and months than be surprised by it.
A 5% or 10% pullback would not surprise me. It would not require a recession, or even particularly bad economic news. Stocks can give back some ground while the economy and corporate profits keep growing.
What the Allocation Process Is Seeing
I spend the first couple of hours each morning running the allocation process that feeds our portfolio models. It starts with a tactical scorecard that looks at credit markets, economic growth, inflation and Fed policy, and global conditions to determine how much equity risk the models should carry. The equity side then ranks U.S. sectors and global markets using measures of value, momentum, quality, and volatility. Bonds are evaluated separately for credit and interest-rate risk, and I average several recent runs before making changes so one unusual day does not move the portfolio models.
Right now, the broad signal still leans toward stocks, but the rankings underneath it have been moving. Among U.S. sectors, energy, financials, and health care have improved the most over the past month, while technology and communication services have moved toward the bottom. Overseas, Europe and Canada have strengthened while Taiwan and South Korea weakened after leading in July. Those changes are working their way into the equity allocations.
The bond process is moving too. It has shifted toward shorter-term Treasuries and away from intermediate-term corporate and Treasury bonds, taking average duration from about 2.9 years to 2.3. Duration measures how sensitive bond prices are to changes in interest rates, so the portfolios are carrying less interest-rate risk than they were a month ago.
None of these changes is a prediction about which sector, country, or bond will do best next. The process is picking up changes in valuation, company quality, market trends, and risk, and those changes are already showing up in the portfolio models.
There are good reasons to expect a rougher market over the coming months, but I don’t see evidence that the economy is breaking. I’ll keep following the data, adjusting the portfolio models when it changes, and doing my best to keep you informed.
Disclosure:
This material is provided by Todd Van Der Meid, MBA, CFP®, through Rhino Wealth Management, Inc., a Registered Investment Adviser, solely for informational purposes. It is not intended as investment, tax, legal, or accounting advice. Investors should consult qualified professionals before making financial decisions.
Opinions expressed herein are general in nature and not tailored to individual circumstances. Investment strategies discussed may not be suitable for every investor. All investments carry risk, including possible loss of principal, and past performance does not guarantee future results. No investment strategy or risk management technique ensures profit or eliminates risk in all market conditions.
Investments in foreign or emerging markets involve additional risk, such as currency fluctuations, geopolitical instability, and varying accounting standards. Sector-specific investments can be more volatile due to their concentrated nature. References to indexes are for illustrative purposes; indexes are unmanaged, cannot be invested into directly, and their performance does not reflect fees, expenses, or sales charges. Index performance is not indicative of specific investment performance.
Economic forecasts and forward-looking statements reflect current views and assumptions and are subject to change. Actual results may vary materially due to market or other conditions. There is no obligation to update forward-looking information.
Information presented herein comes from reliable third-party sources but is not guaranteed for accuracy or completeness. Rhino Wealth Management, Inc. disclaims liability for errors or omissions. Portions of this content may be generated using advanced analytical tools, including artificial intelligence, and all such content has been reviewed and validated by Todd Van Der Meid, MBA, CFP®, using proprietary quality-control measures. Rhino Wealth Management, Inc. does not directly hold securities; however, securities mentioned may be included within recommended portfolio models or held by clients. Please refer to our Form ADV for additional details regarding potential conflicts of interest.