

The Stock Market is Leaning on One Story
The S&P 500 finished the week down 0.27% as investors weighed a weak September jobs report and stubborn inflation. Meanwhile, the 10-year Treasury yield reached 5.34% on Thursday, its highest level in more than two decades.
The September jobs report was weaker than expected. Employers added 29,000 jobs against forecasts of about 90,000, and unemployment ticked up to 4.2%. Some economists consider anything below 5% to be full employment, so I read this as a job market that's cooling, not one in trouble. It gives the Fed cover to hold rates at its October meeting unless the October 14 inflation report comes in hot, and with manufacturers paying more for materials, that's a real possibility.
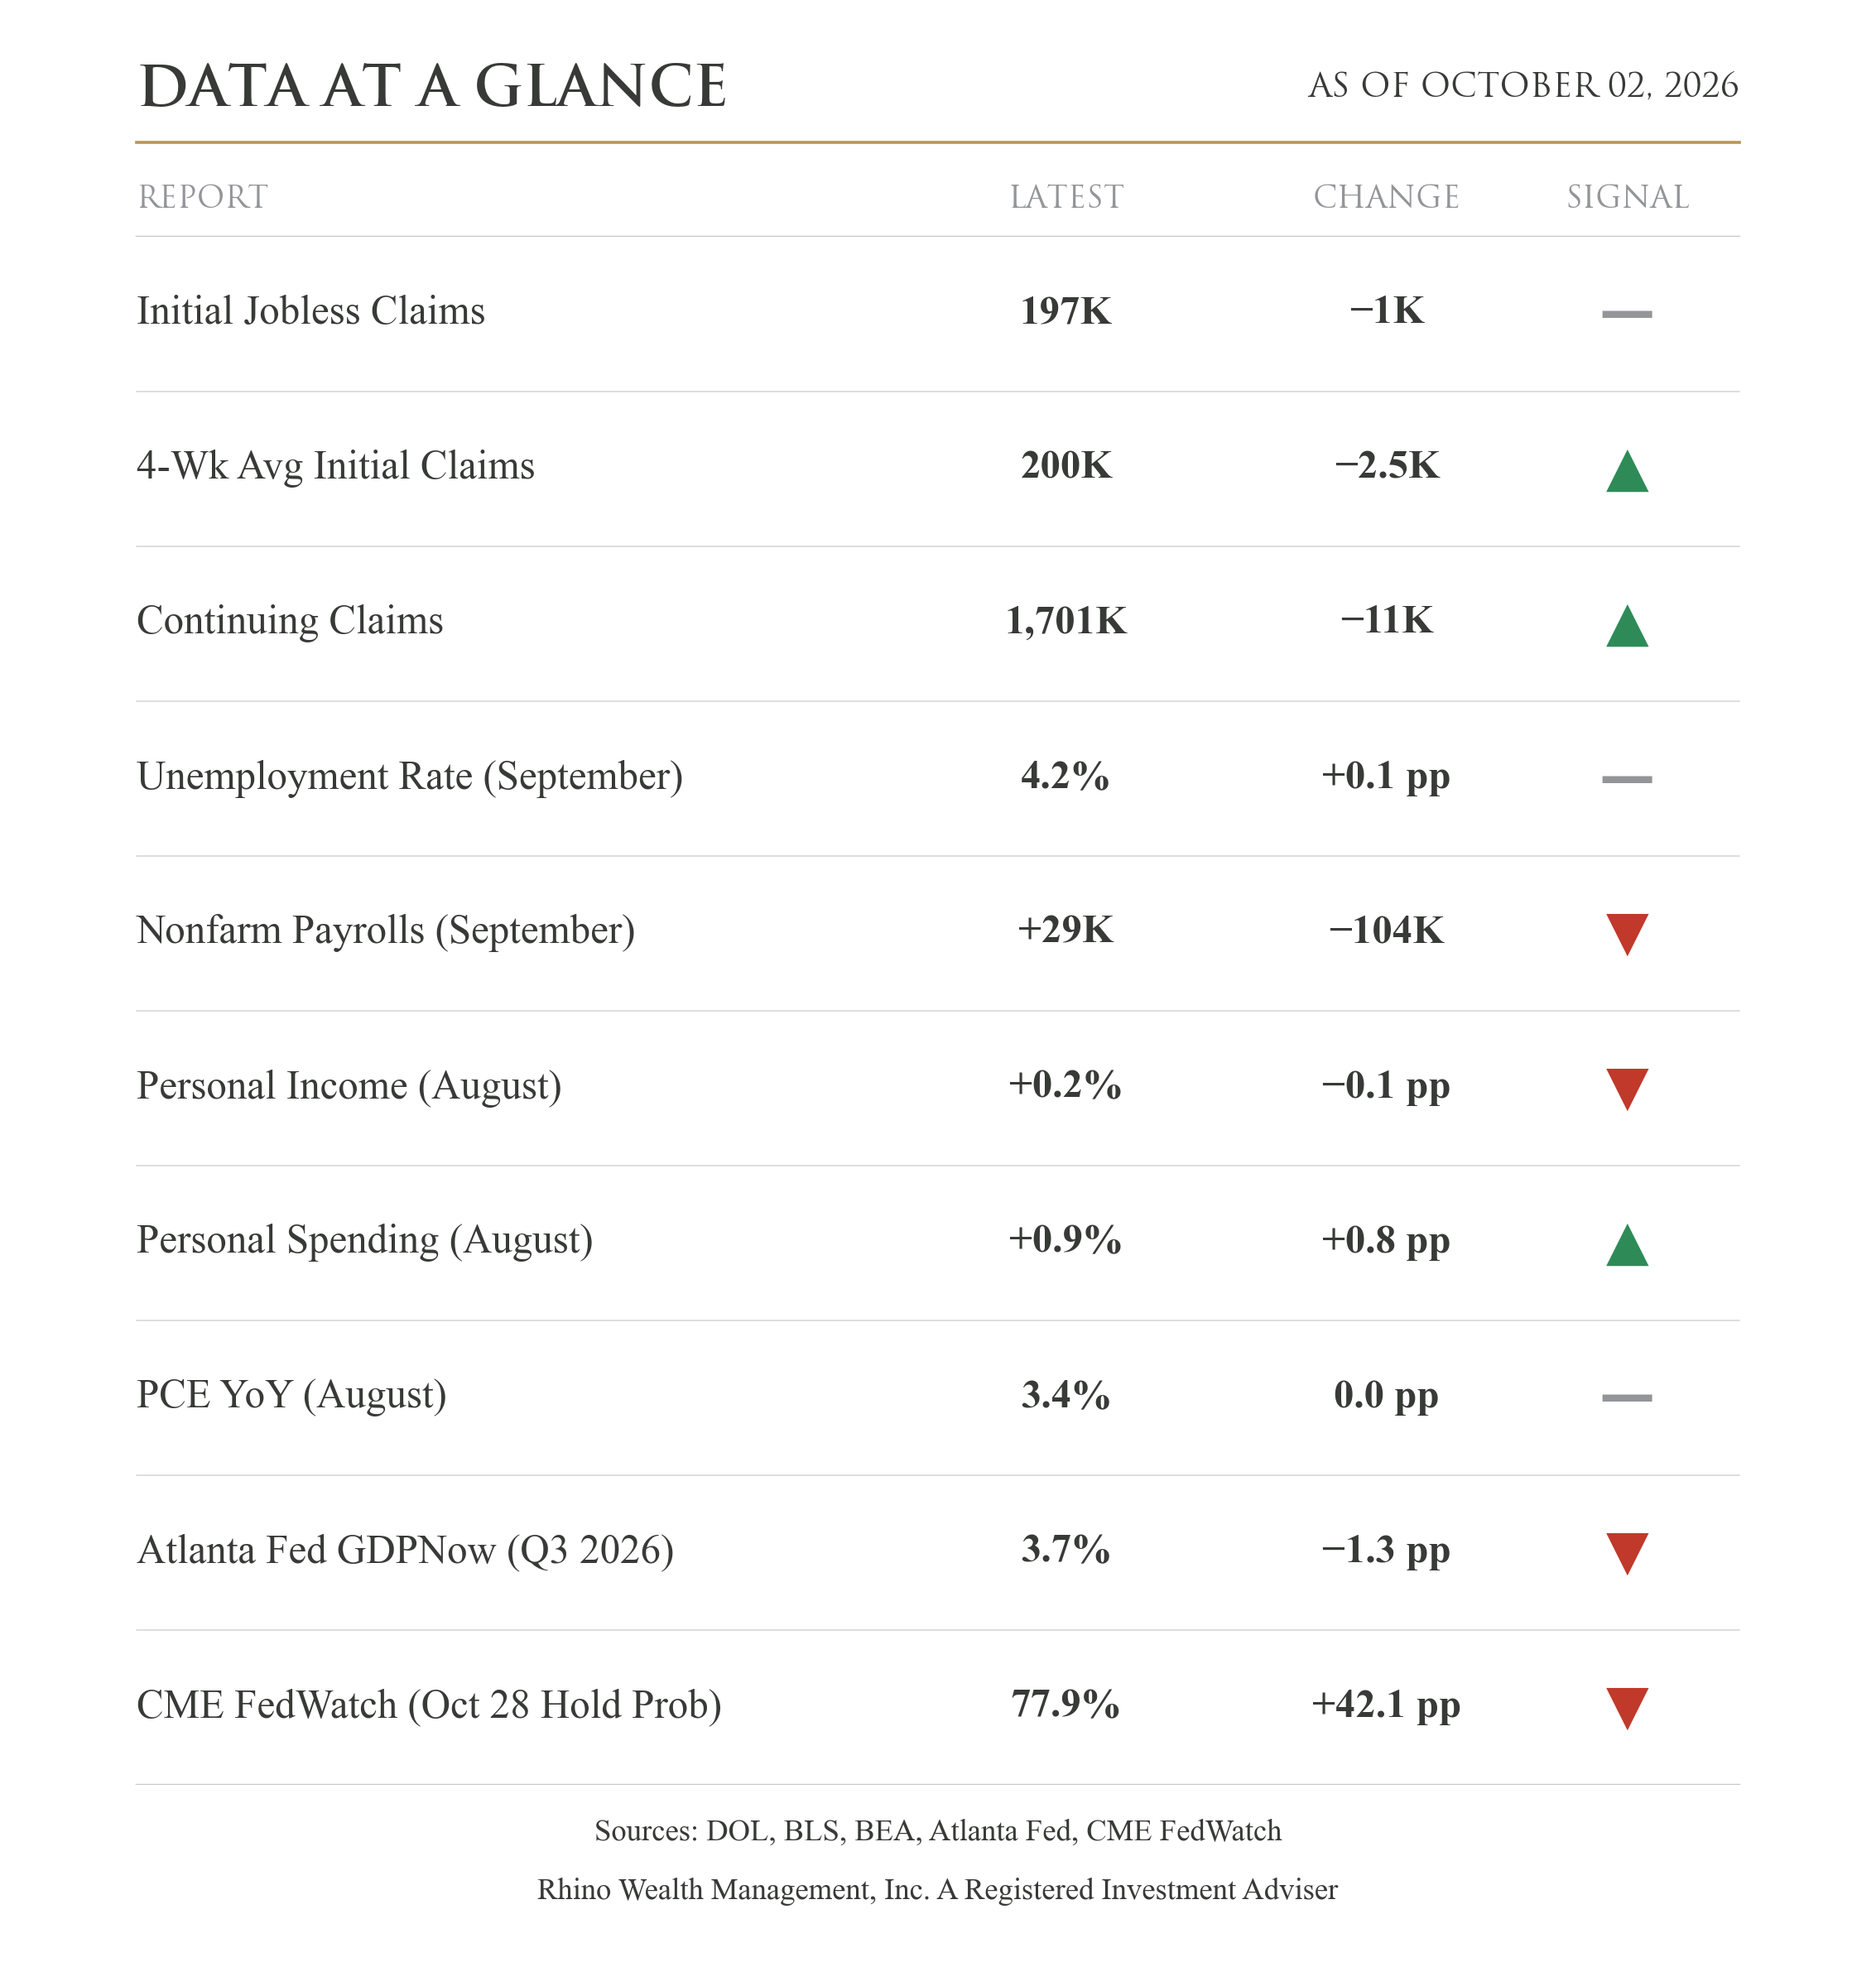
New and continuing claims for unemployment benefits are still low, which tells me employers are holding off on hiring rather than letting people go. Spending jumped in August while income grew more slowly, so people likely dipped into savings or leaned more on credit to keep spending. Futures markets now put the odds of the Fed holding rates steady in October at about 78%.
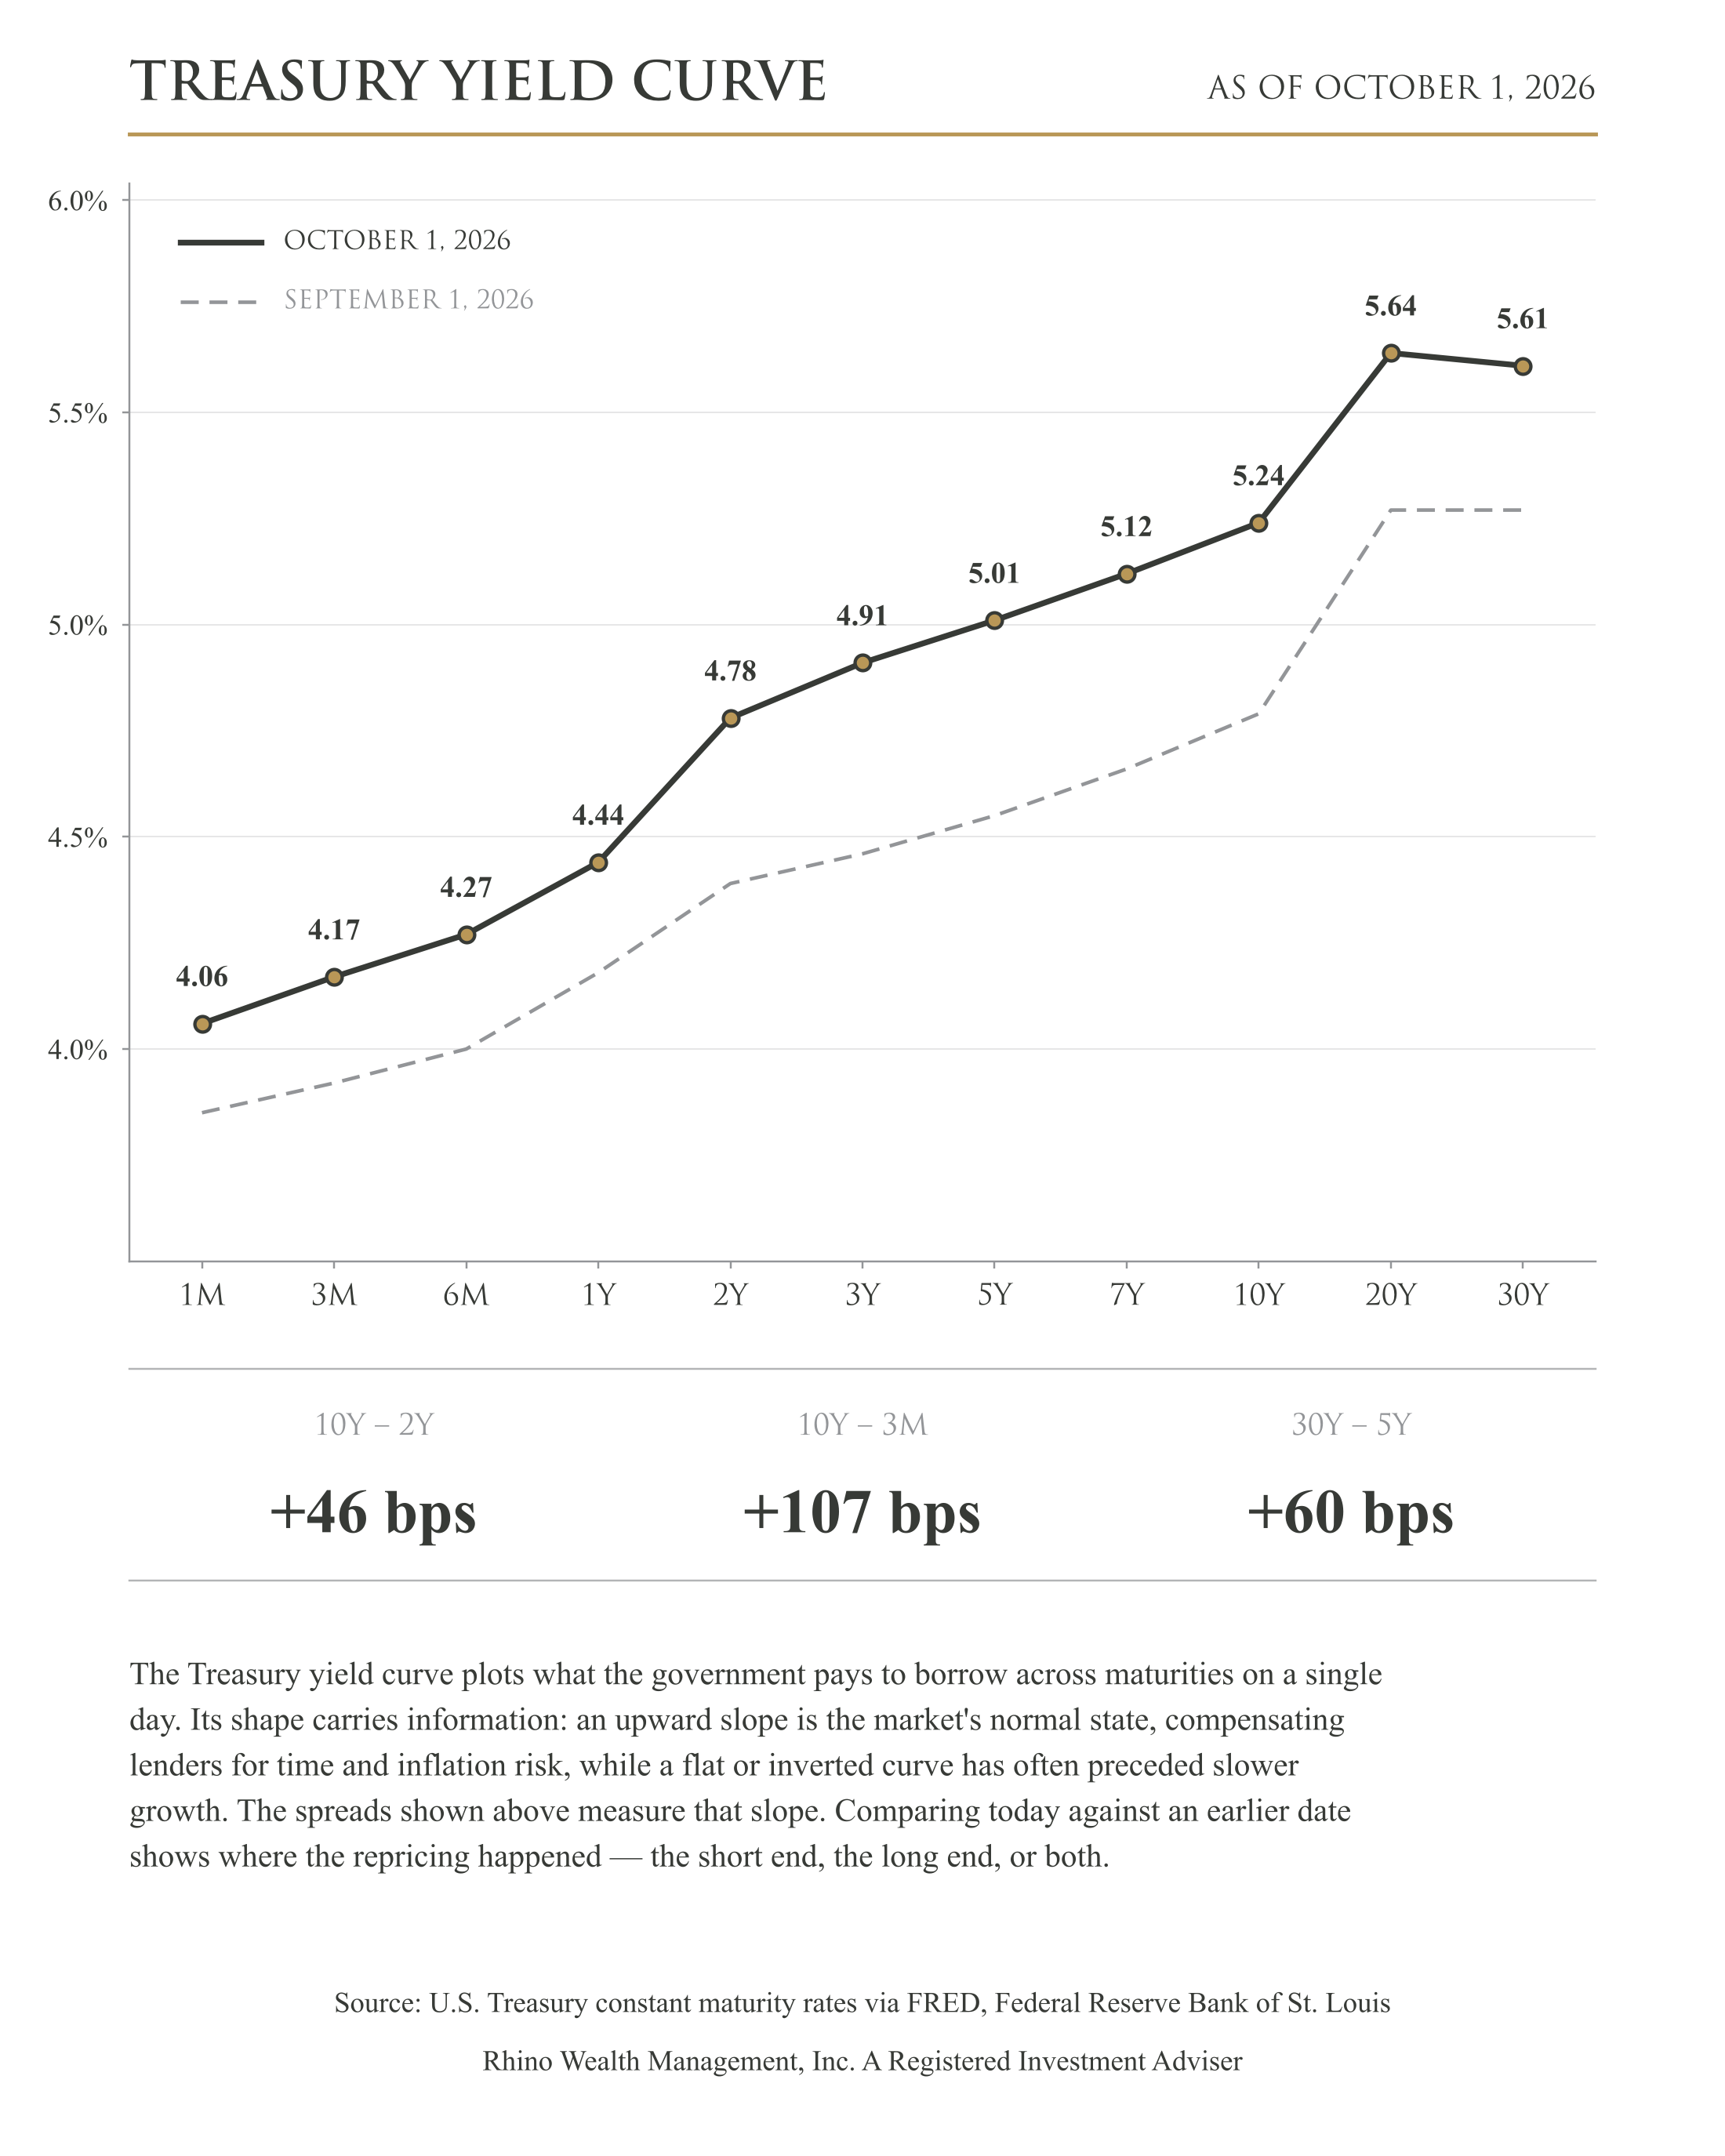
Rates rose across every maturity over the past month, from one-month bills to 30-year bonds. The 10-year yield, which mortgage rates follow, rose almost half a percentage point, and the average 30-year mortgage is back above 7%.
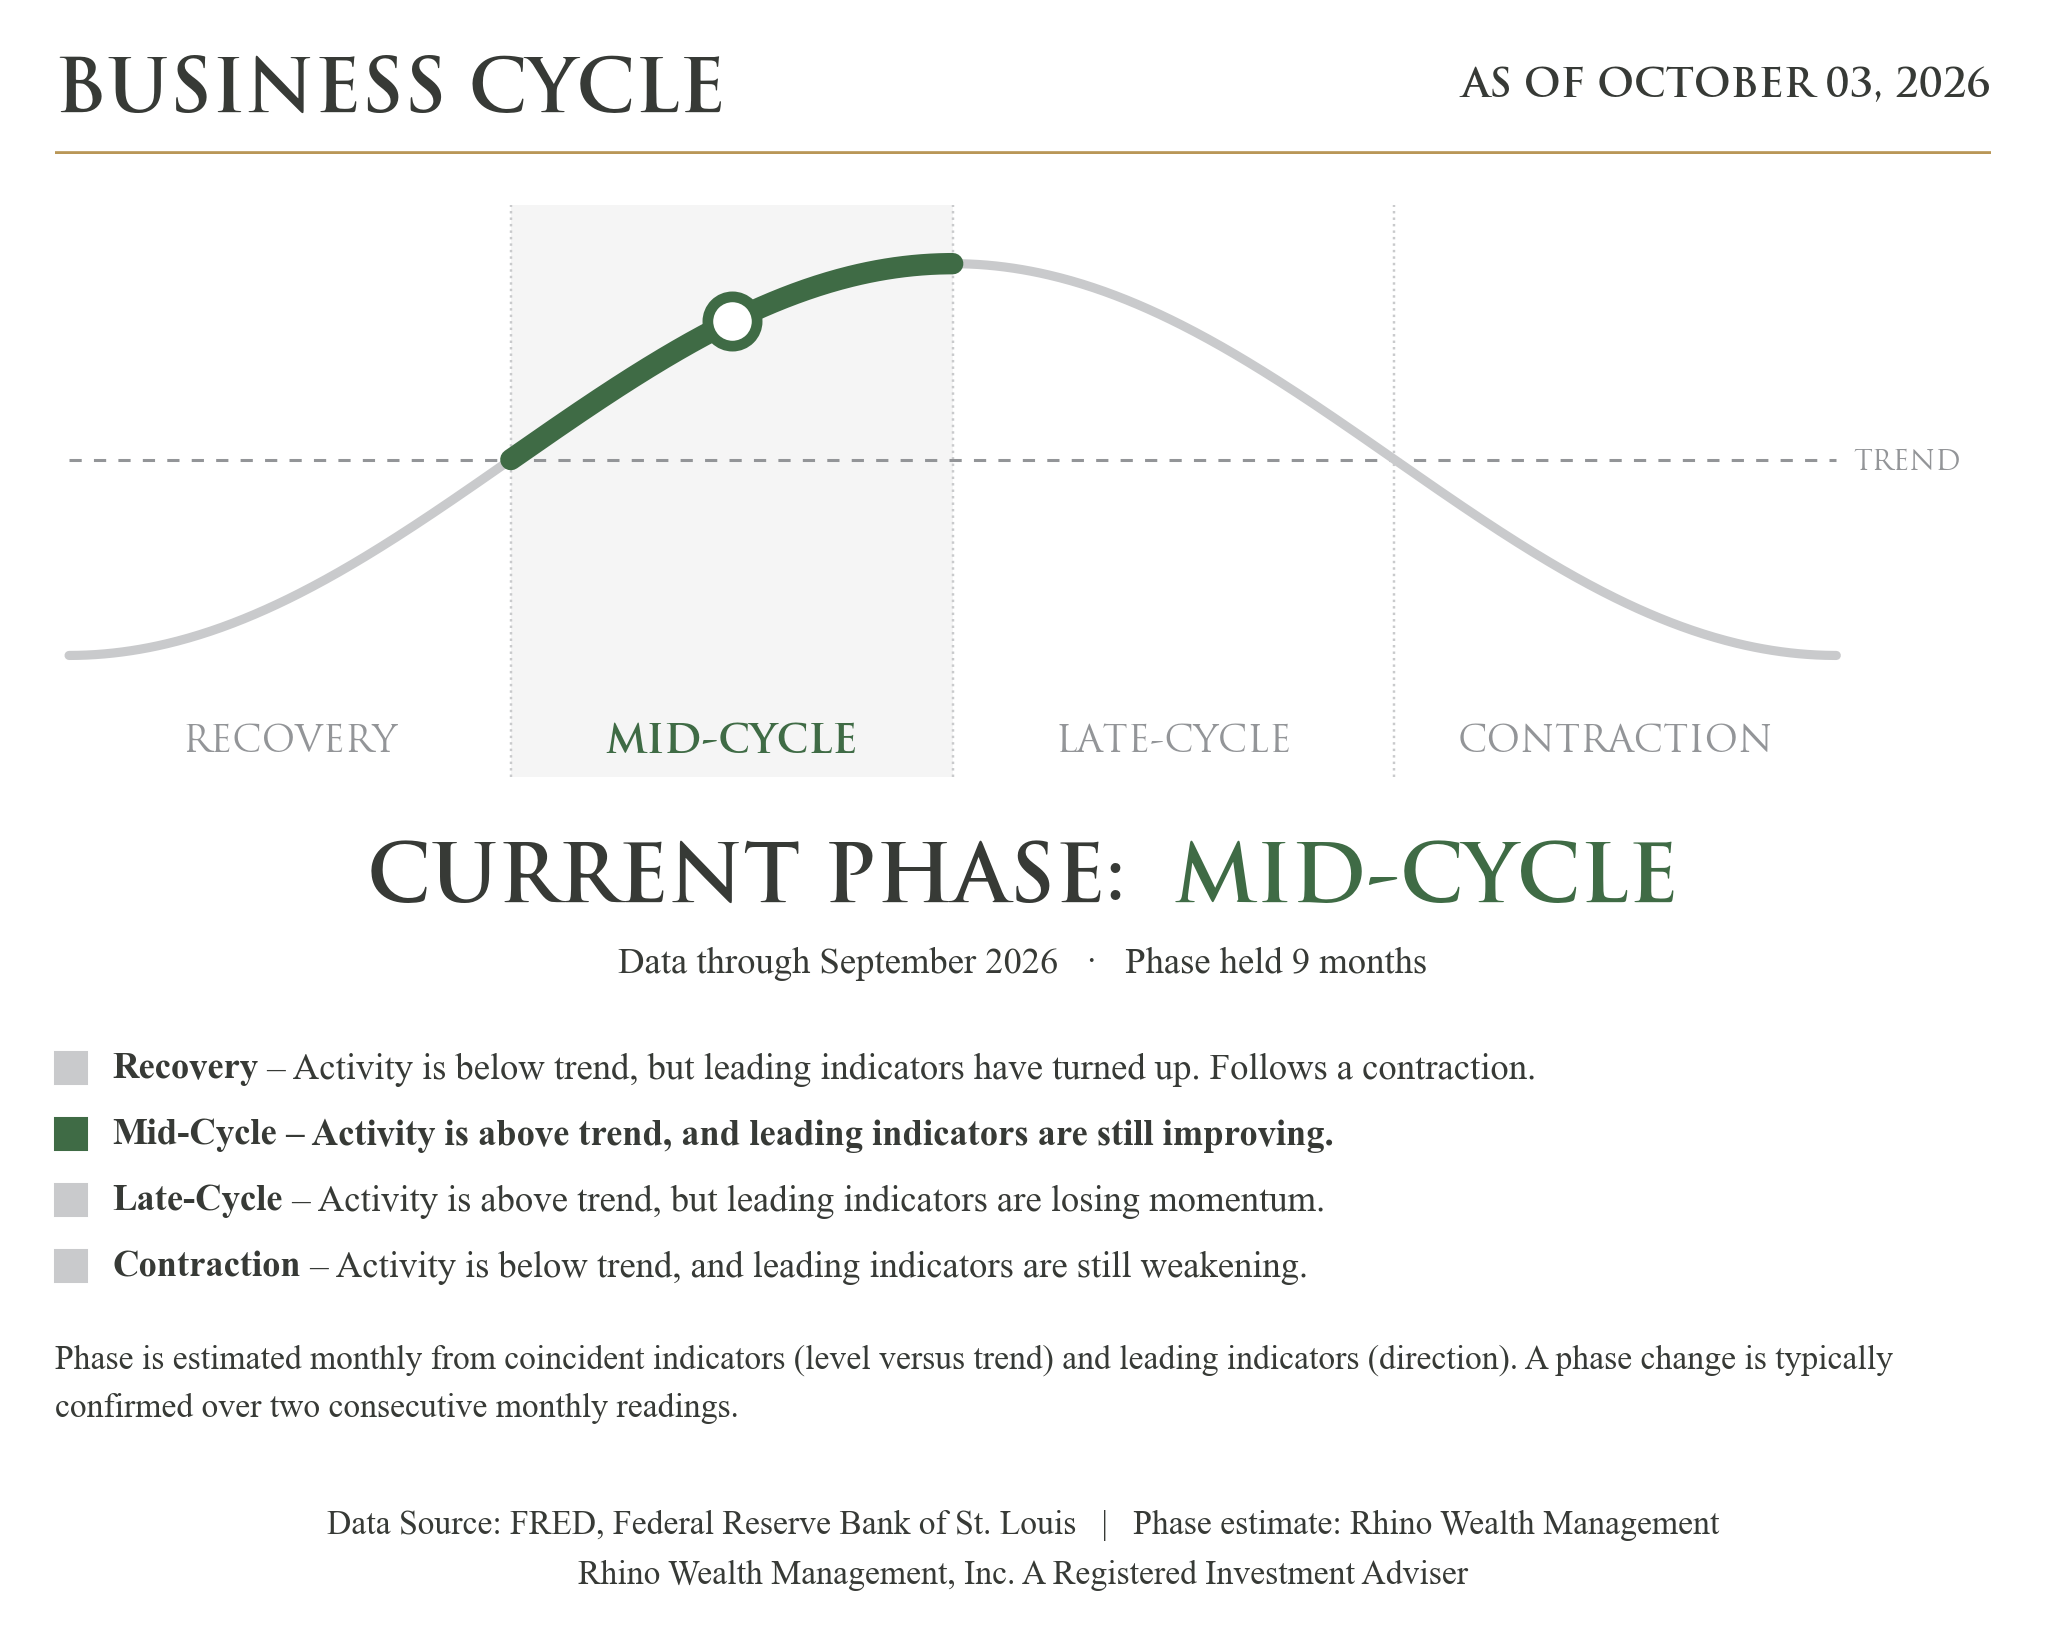
This graphic is new this week. I built a business cycle model to track where the U.S. economy stands, using 21 data series from the Federal Reserve's FRED database, each with 15 years of history. It has read mid-cycle since January, meaning activity is above its long-term trend and the indicators that tend to lead the economy are still improving. In past cycles, Fed rate hikes are what eventually slowed the economy and moved it into the next phase, and with a hike in September and another expected in December, I want to see whether that starts to take hold. It's a read on the economy rather than a forecast for stocks.
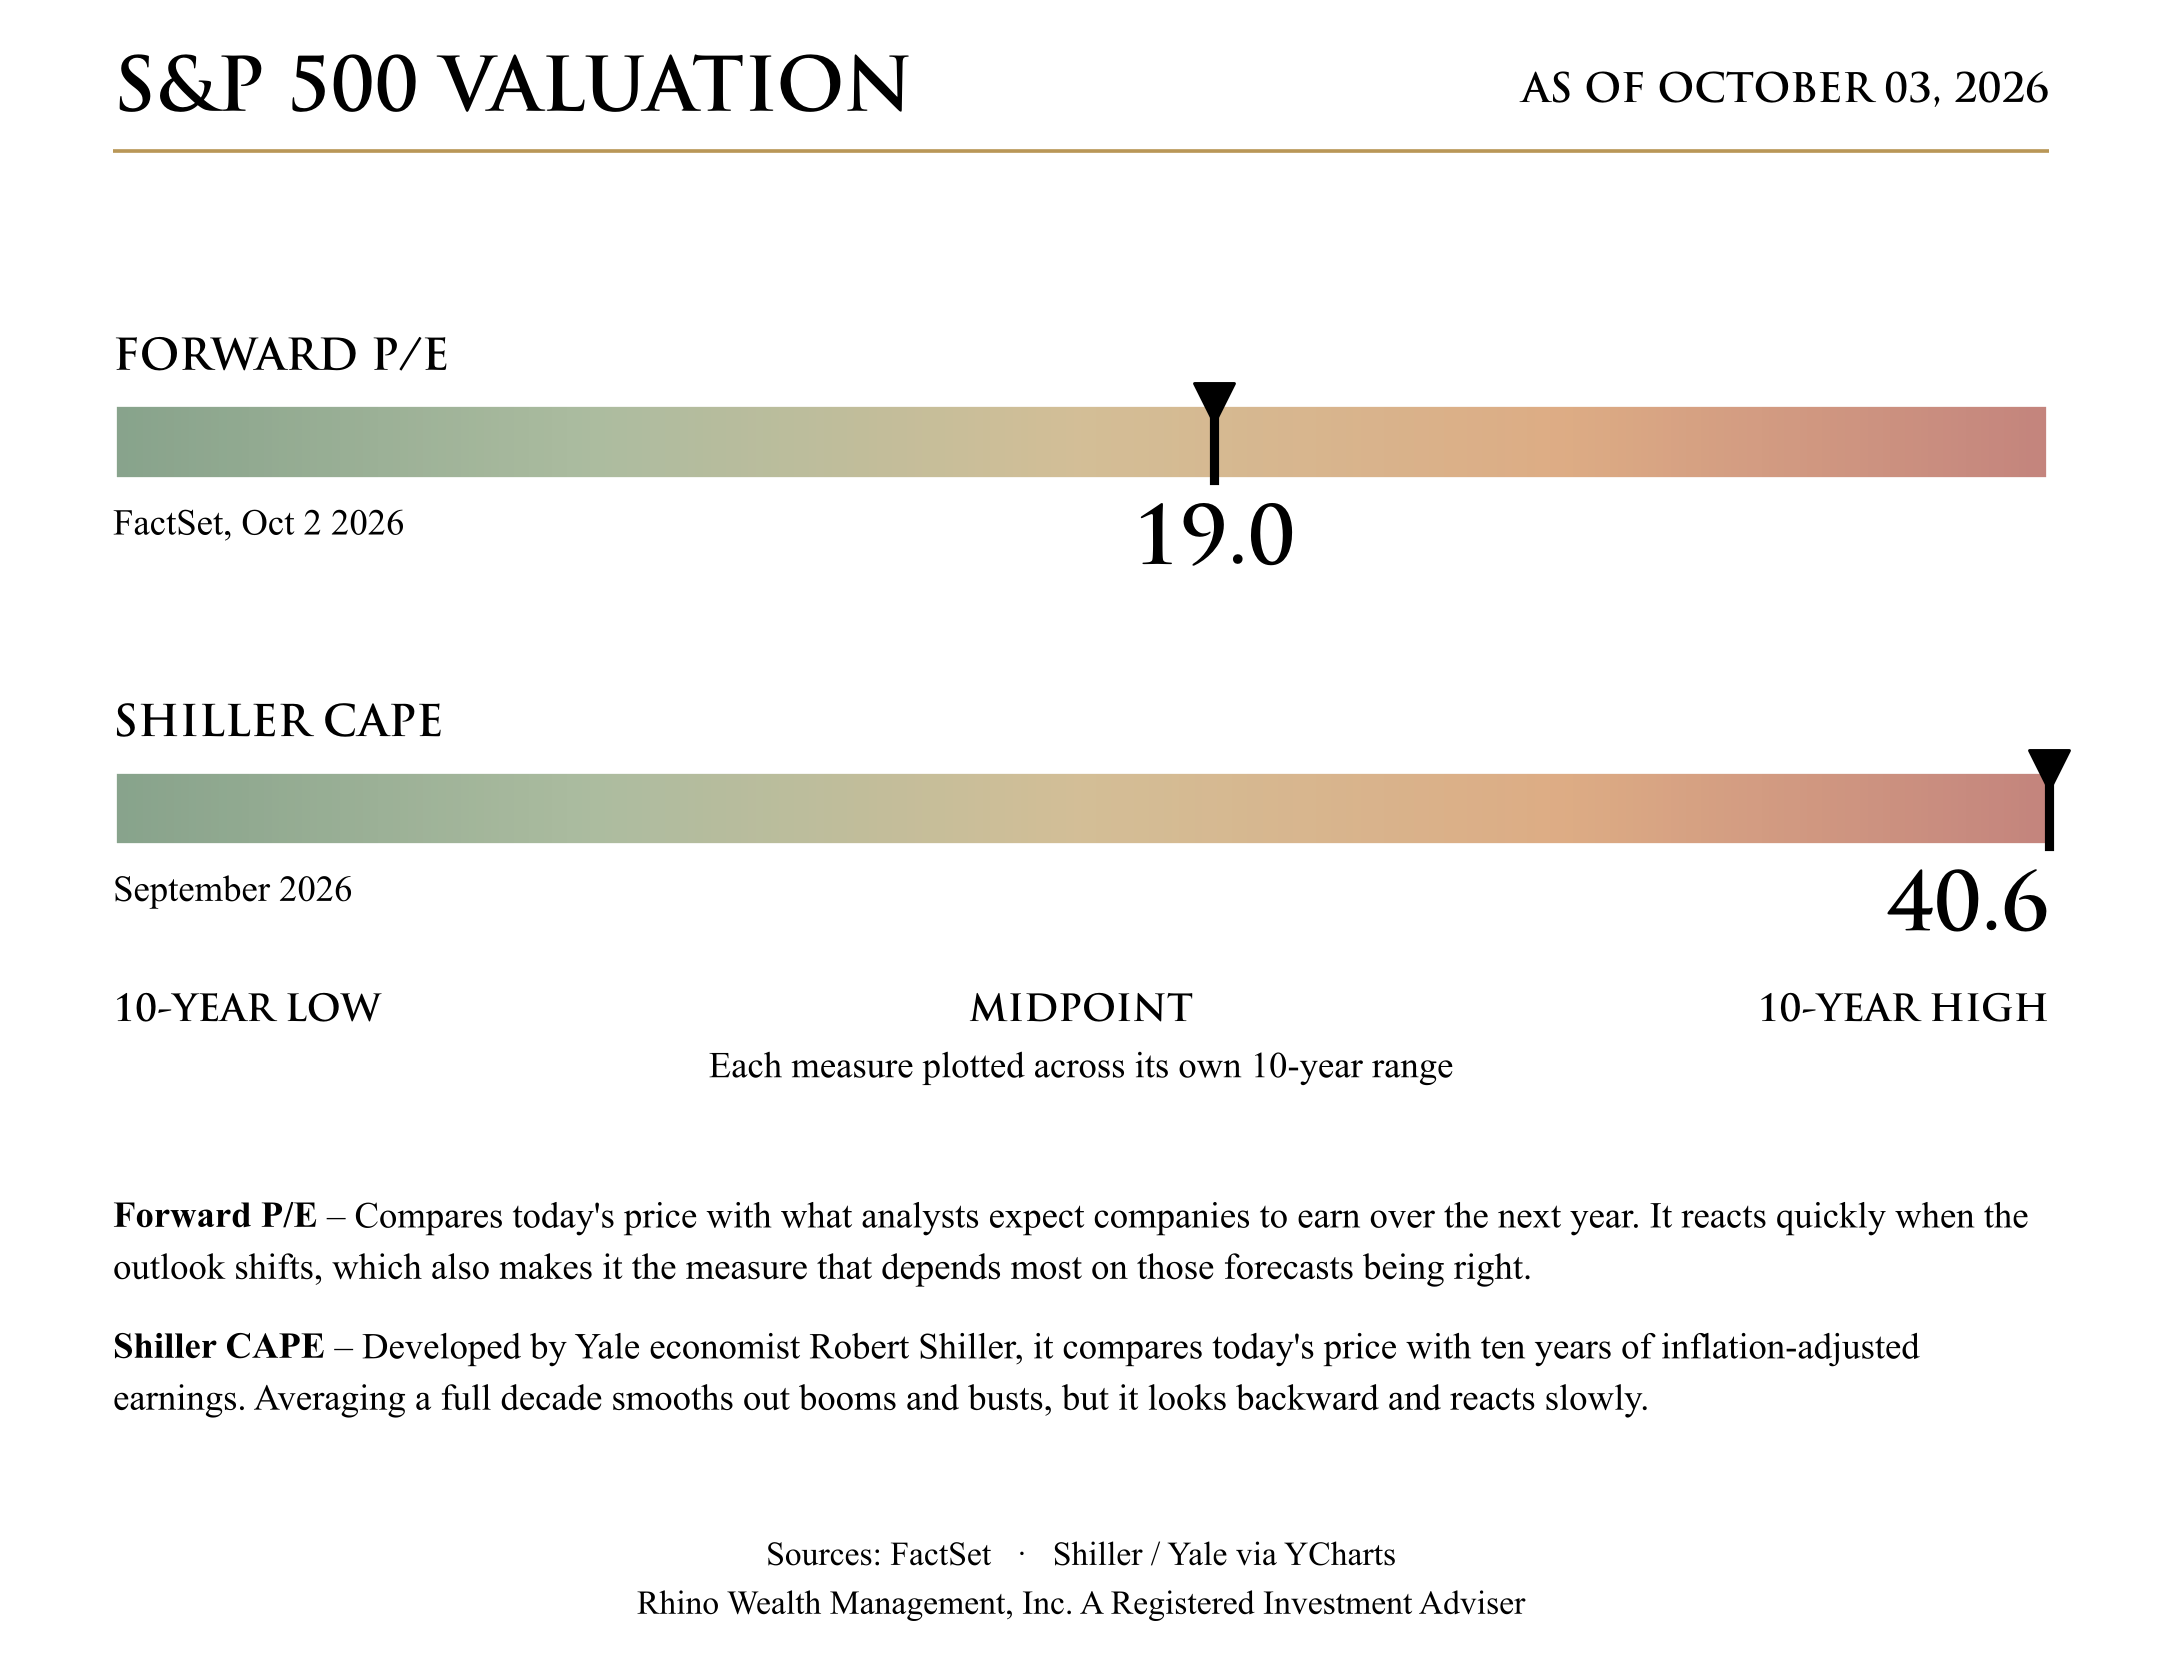
Forward P/E compares today's price with what companies are expected to earn over the next year. At 19, it's in line with its 10-year average of 19.1, and analysts expect third-quarter earnings to grow 29.5% from a year ago. The Shiller CAPE looks back at 10 years of earnings, so it doesn't capture how quickly profits are growing now, which is why it's at the top of its range. Based on expected earnings the market isn't expensive, but those expectations lean heavily on one theme: AI infrastructure spending and the productivity gains it's supposed to bring. If anything calls that story into question, earnings forecasts would come down and the market would look a lot more expensive.
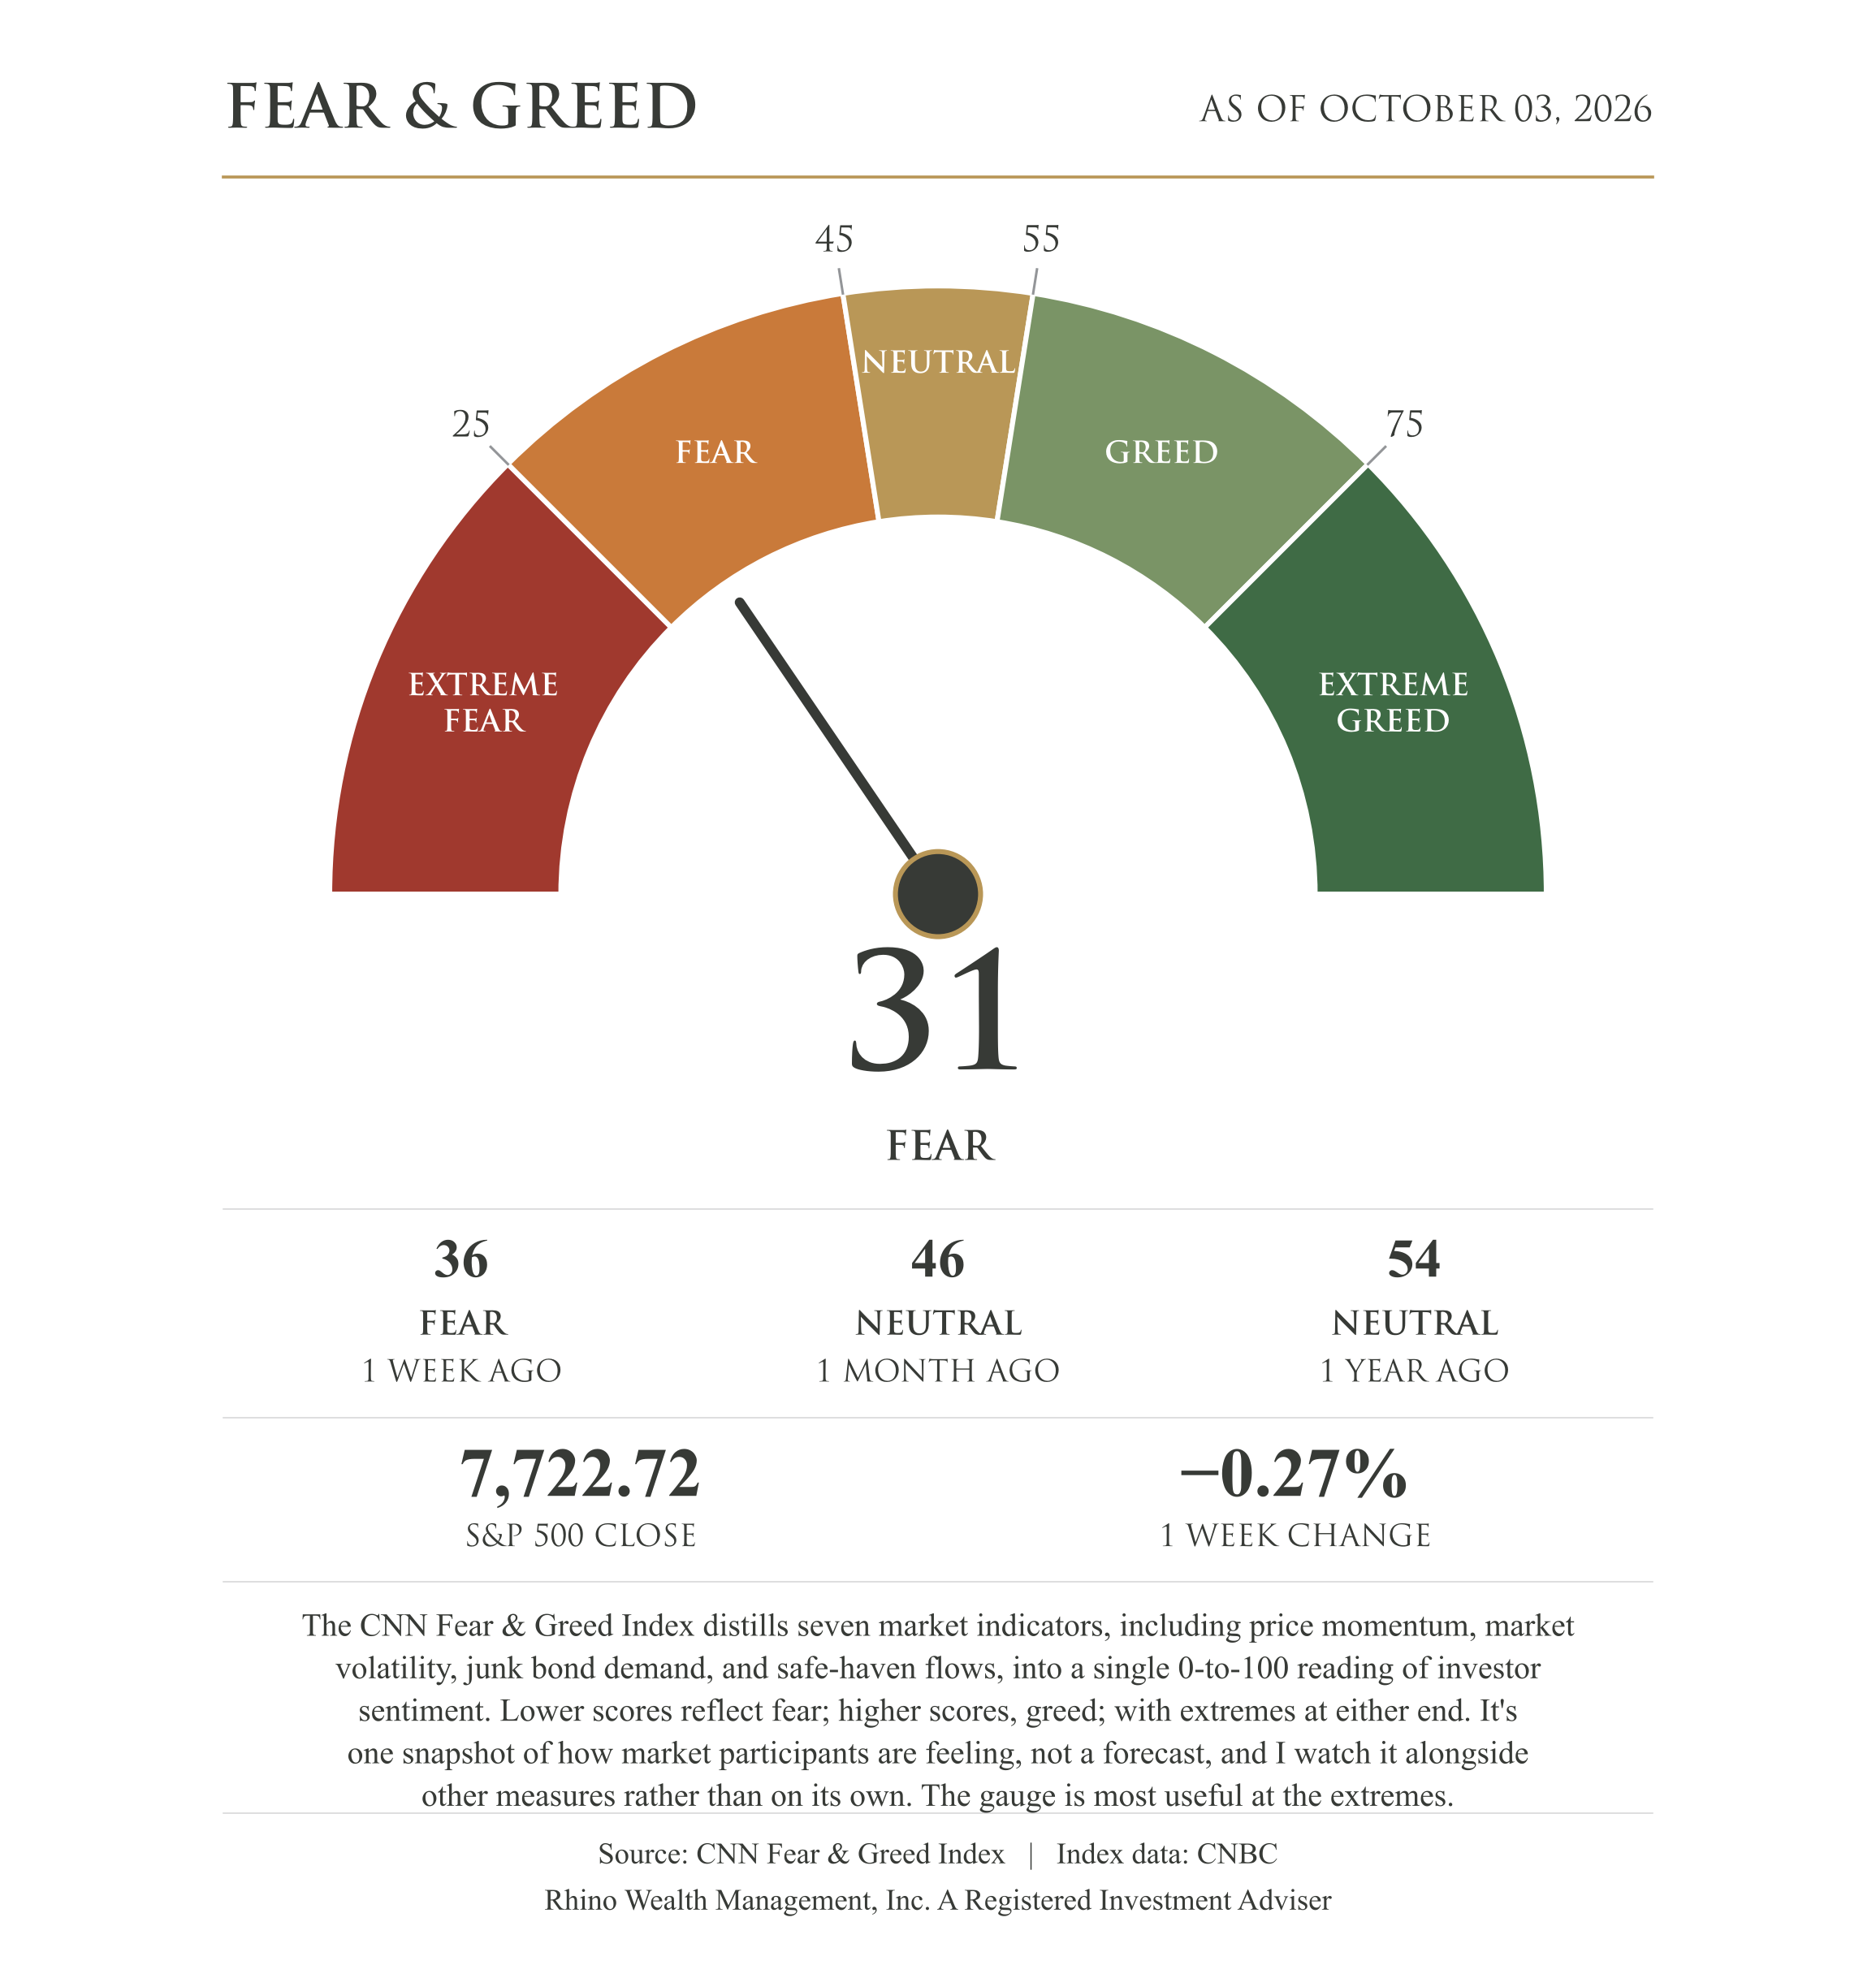
Investor sentiment slipped further into fear this week, falling to 31 from 36 after sitting at neutral a month ago. The market itself barely moved, so this reflects nervousness more than selling, and since the gauge is most useful at the extremes, I'm not reading much into it yet.
Over the next few weeks, I'll be watching the October 14 inflation report and the Fed meeting at the end of the month. Third-quarter earnings season also gets underway this month, and I'll be paying close attention to what the biggest AI spenders say about their plans.
Disclosure:
This material is provided by Todd Van Der Meid, MBA, CFP®, through Rhino Wealth Management, Inc., a Registered Investment Adviser, solely for informational purposes. It is not intended as investment, tax, legal, or accounting advice. Investors should consult qualified professionals before making financial decisions.
Opinions expressed herein are general in nature and not tailored to individual circumstances. Investment strategies discussed may not be suitable for every investor. All investments carry risk, including possible loss of principal, and past performance does not guarantee future results. No investment strategy or risk management technique ensures profit or eliminates risk in all market conditions.
Investments in foreign or emerging markets involve additional risk, such as currency fluctuations, geopolitical instability, and varying accounting standards. Sector-specific investments can be more volatile due to their concentrated nature. References to indexes are for illustrative purposes; indexes are unmanaged, cannot be invested into directly, and their performance does not reflect fees, expenses, or sales charges. Index performance is not indicative of specific investment performance.
Economic forecasts and forward-looking statements reflect current views and assumptions and are subject to change. Actual results may vary materially due to market or other conditions. There is no obligation to update forward-looking information.
Information presented herein comes from reliable third-party sources but is not guaranteed for accuracy or completeness. Rhino Wealth Management, Inc. disclaims liability for errors or omissions. Portions of this content may be generated using advanced analytical tools, including artificial intelligence, and all such content has been reviewed and validated by Todd Van Der Meid, MBA, CFP®, using proprietary quality-control measures. Rhino Wealth Management, Inc. does not directly hold securities; however, securities mentioned may be included within recommended portfolio models or held by clients. Please refer to our Form ADV for additional details regarding potential conflicts of interest.