

Stocks hit a record as yields reach a 24-year high
The S&P 500 closed the week at 7,811, up 1.15%, after hitting a new all-time high on Tuesday. The 10-year Treasury yield touched 5.36% on Wednesday, its highest level in 24 years.
Bond yields (the interest rates the government and companies pay to borrow) are rising because the government is borrowing heavily and the Fed raised rates in September to fight stubborn inflation. Investors are demanding higher yields to lend the government money to finance its budget deficit. Companies are also borrowing to fund the buildout of AI infrastructure. With the government and the private sector competing for the same lenders, the cost of borrowing is going up. That reaches consumers too, as mortgage and auto loan rates climb along with it.
Stocks are up because corporate earnings are growing faster than borrowing costs. That works as long as earnings keep outrunning the cost of money. We've seen an economy like this before, in 1999 and early 2000, near the end of the infrastructure buildout that became the internet. The period ended well for some companies and not so well for others, and it's too early to know which companies will land on which side this time.
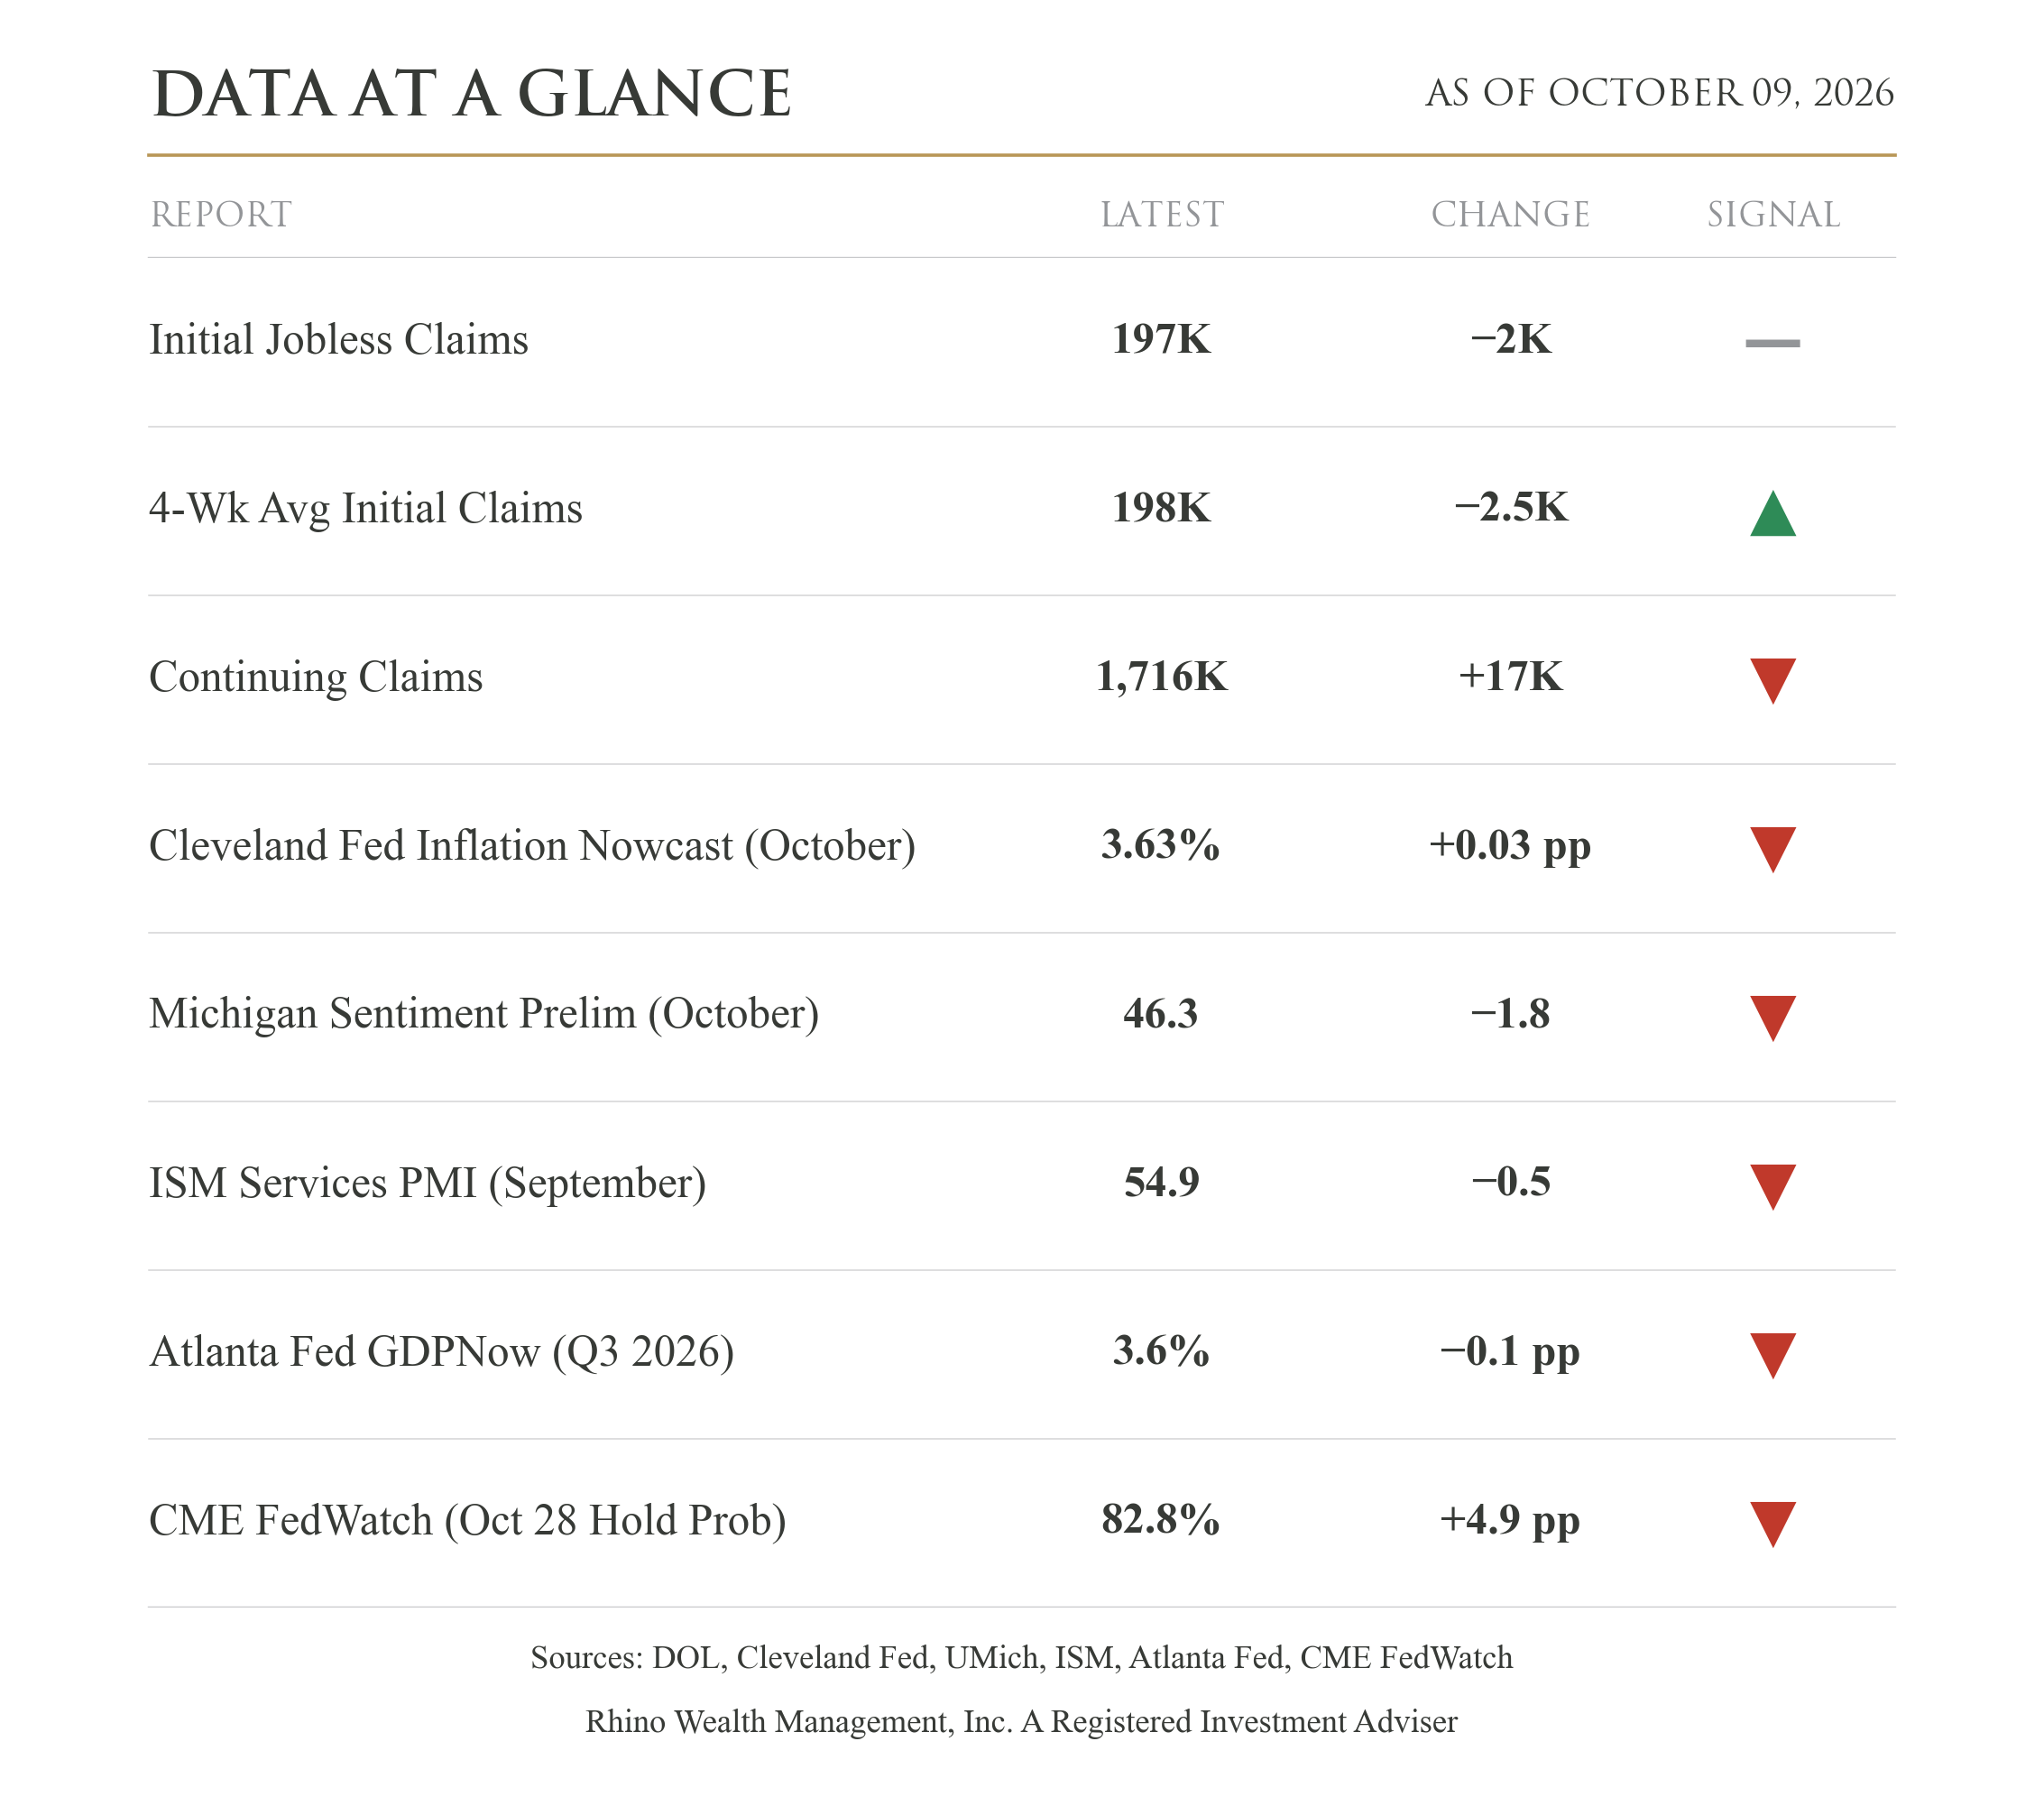
The economy is still growing, but consumers aren't feeling it. The Atlanta Fed's running estimate of third-quarter growth is 3.6%, and the services sector expanded for a 27th straight month. Layoffs remain rare, though people who lose a job are taking longer to find the next one. With last week's 29,000 payroll gain, we're back to the low-hire, low-fire labor market.
Inflation and sentiment are moving the wrong way. The Cleveland Fed's October inflation estimate ticked up to 3.63%, and consumer sentiment fell to 46.3, with views of current conditions at an all-time low. That mix points to the Fed holding rates at its October meeting, with markets expecting a hike by December.
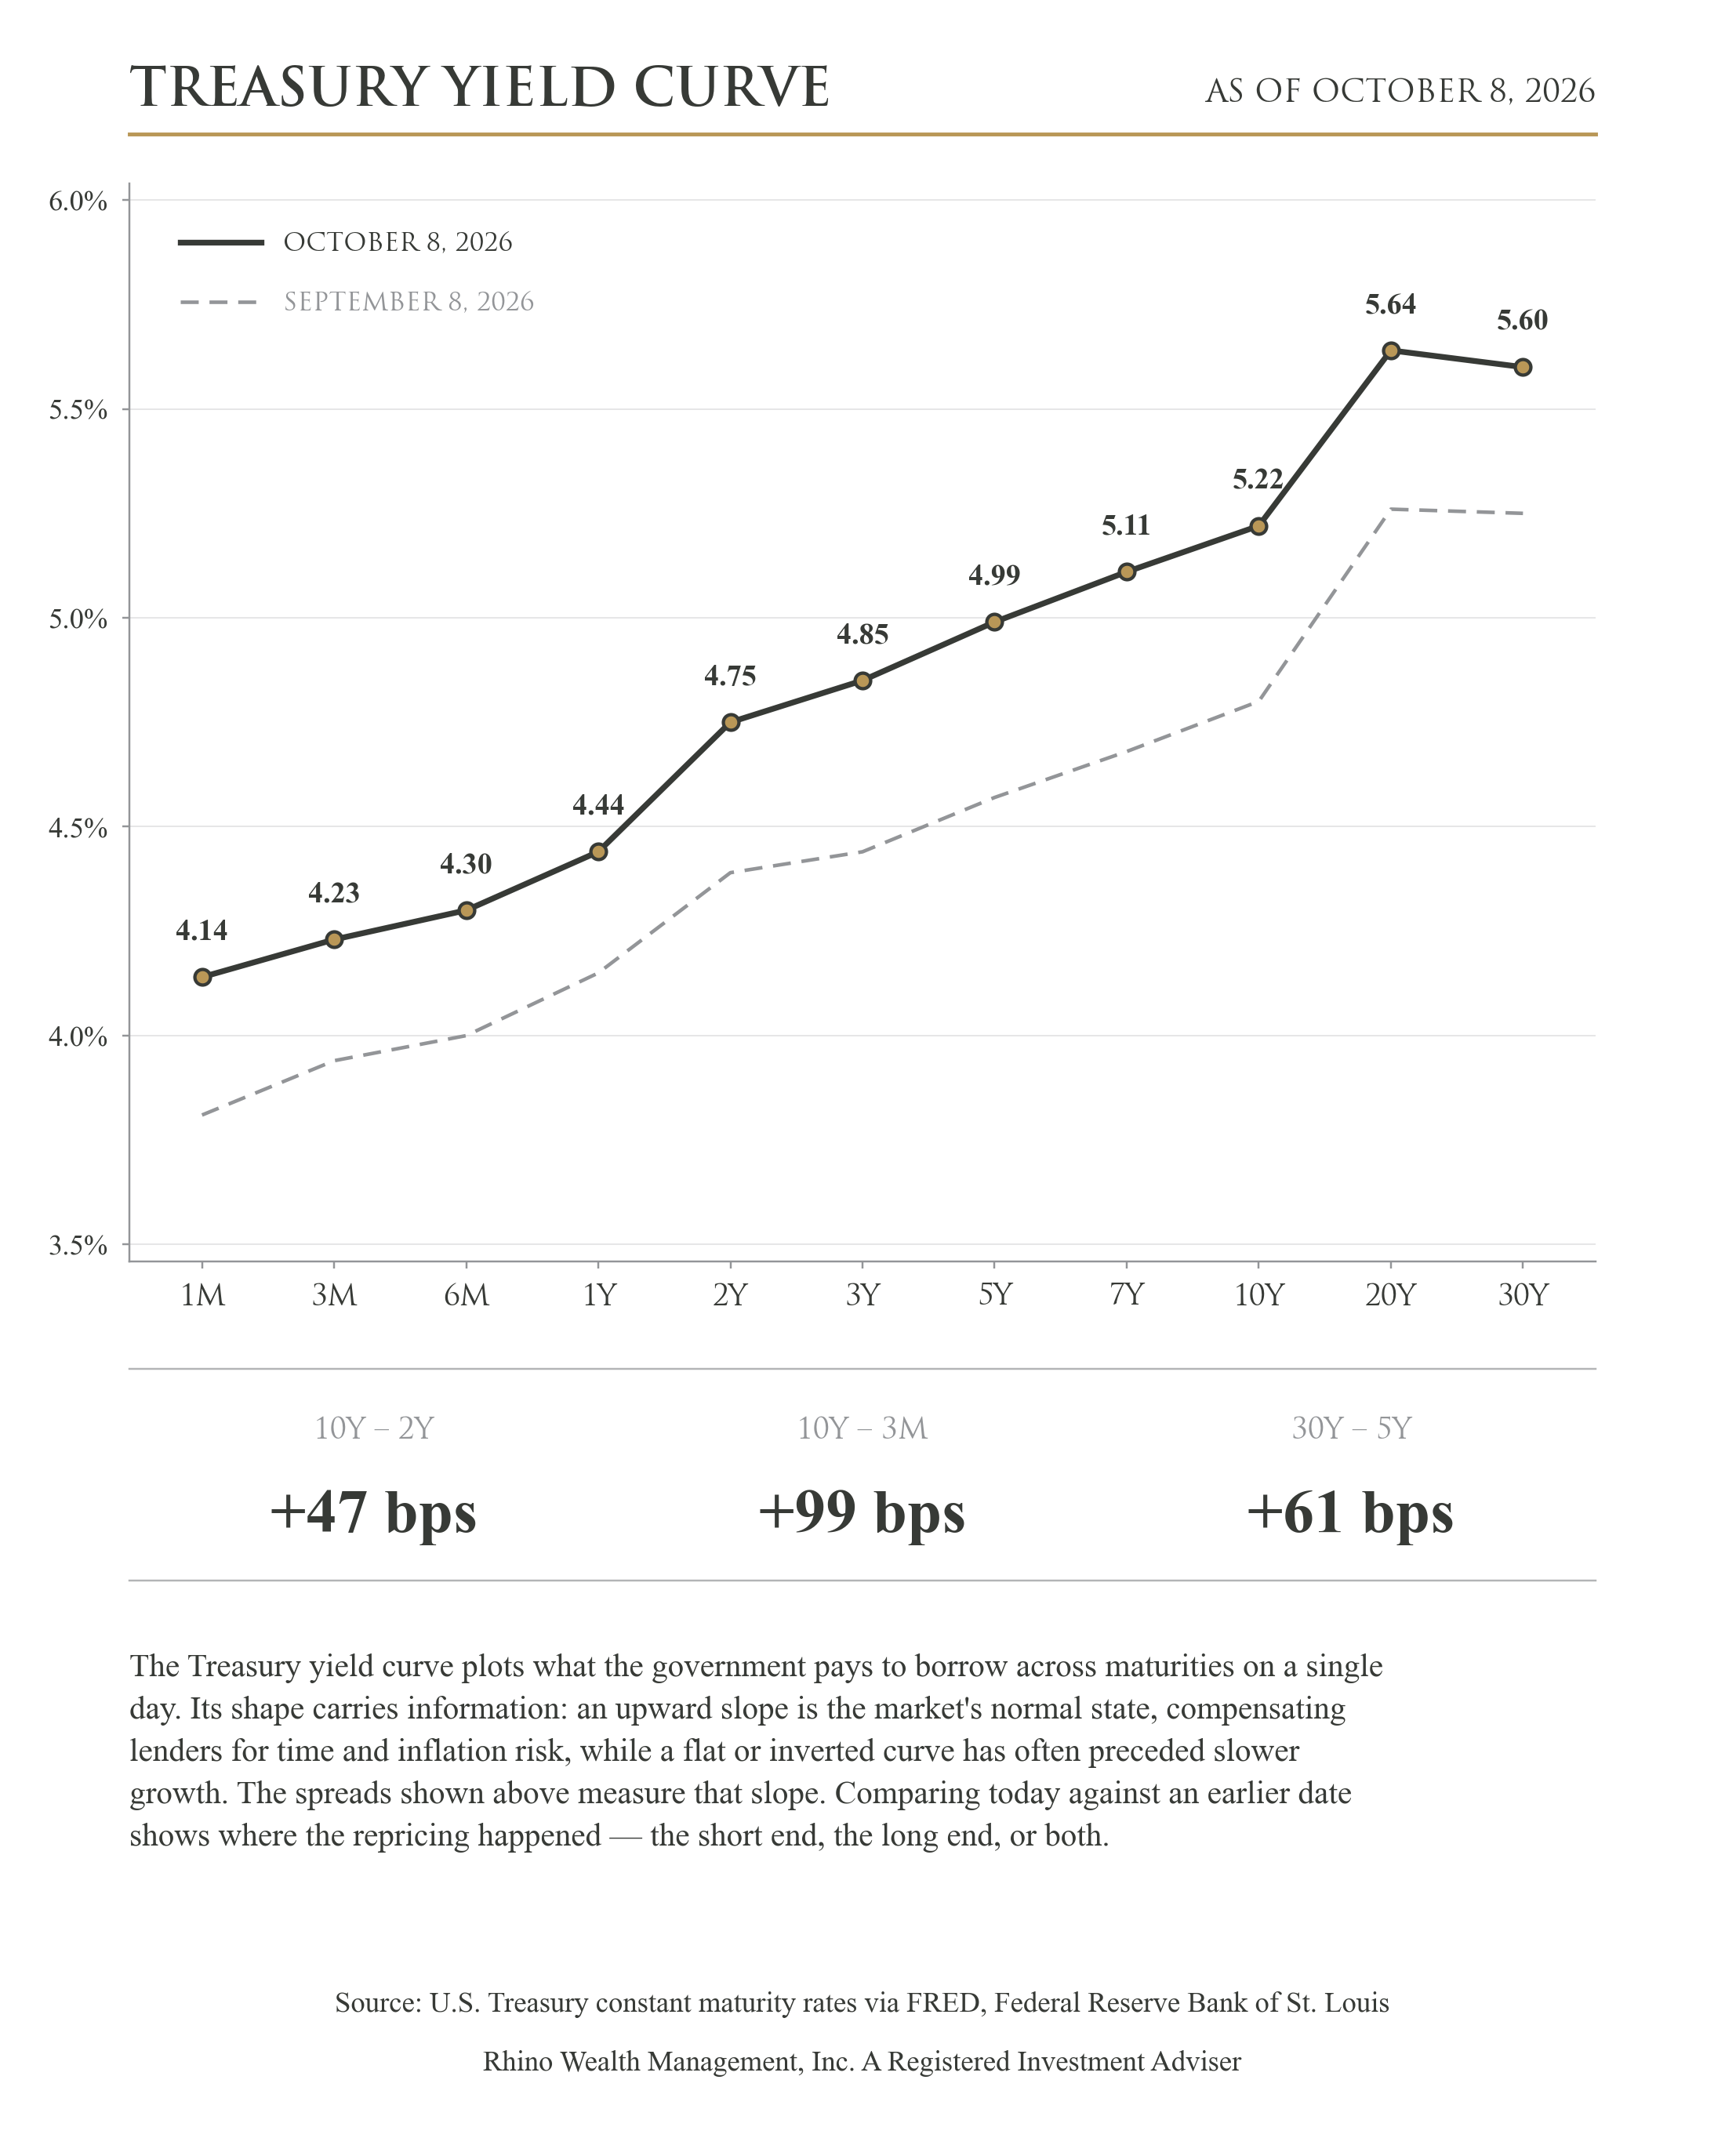
Yields rose across the curve over the past month, a sign that the Fed and borrowing by both companies and the government are pushing rates higher. An upward-sloping curve, with the 10-year paying more than the 2-year, is the normal condition. It isn't sending the recession warning that a flat or inverted curve can.
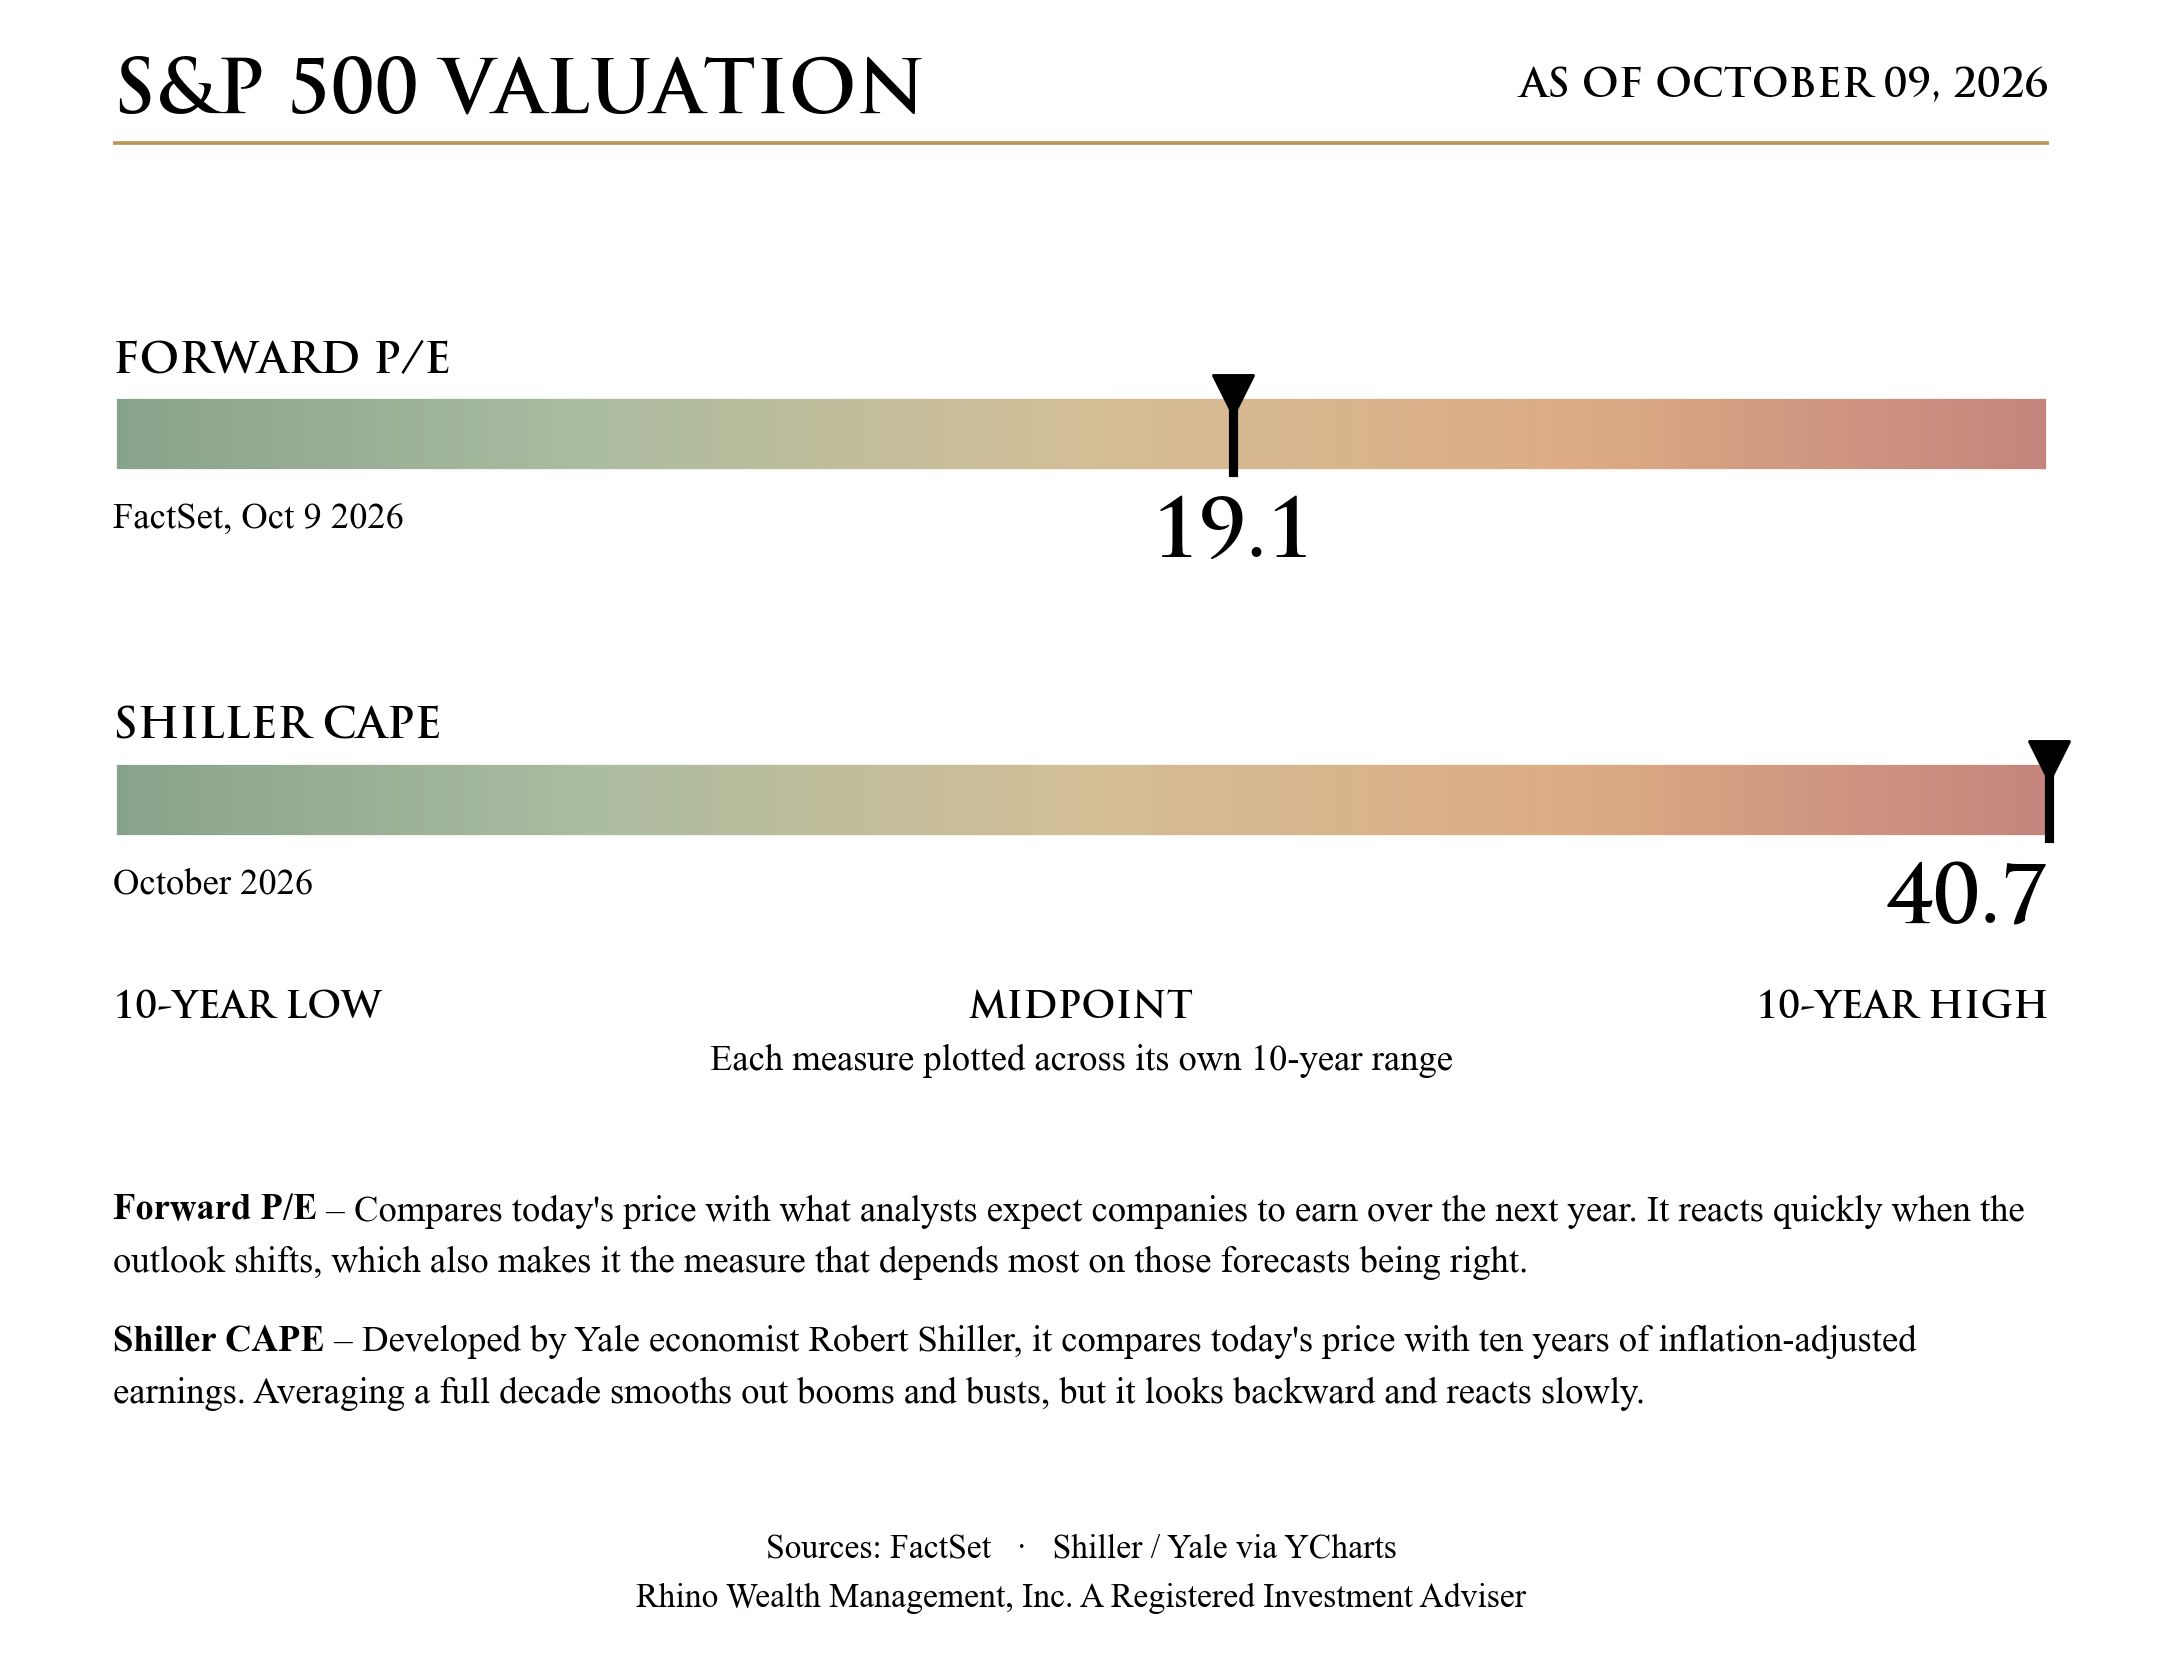
Based on what analysts expect companies to earn over the next year, the market isn't expensive. The forward P/E of 19.1 sits near the middle of its 10-year range. The Shiller CAPE is at a 10-year high because it looks back at a decade of earnings and doesn't capture how quickly profits are growing now. If analysts start cutting their earnings forecasts, the forward P/E would climb, and that picture could change quickly.
Bonds are also competing for investors' money. At 19.1 times expected earnings, stocks offer an earnings yield of about 5.2%, roughly what the 10-year Treasury pays without the risk that profits fall short.
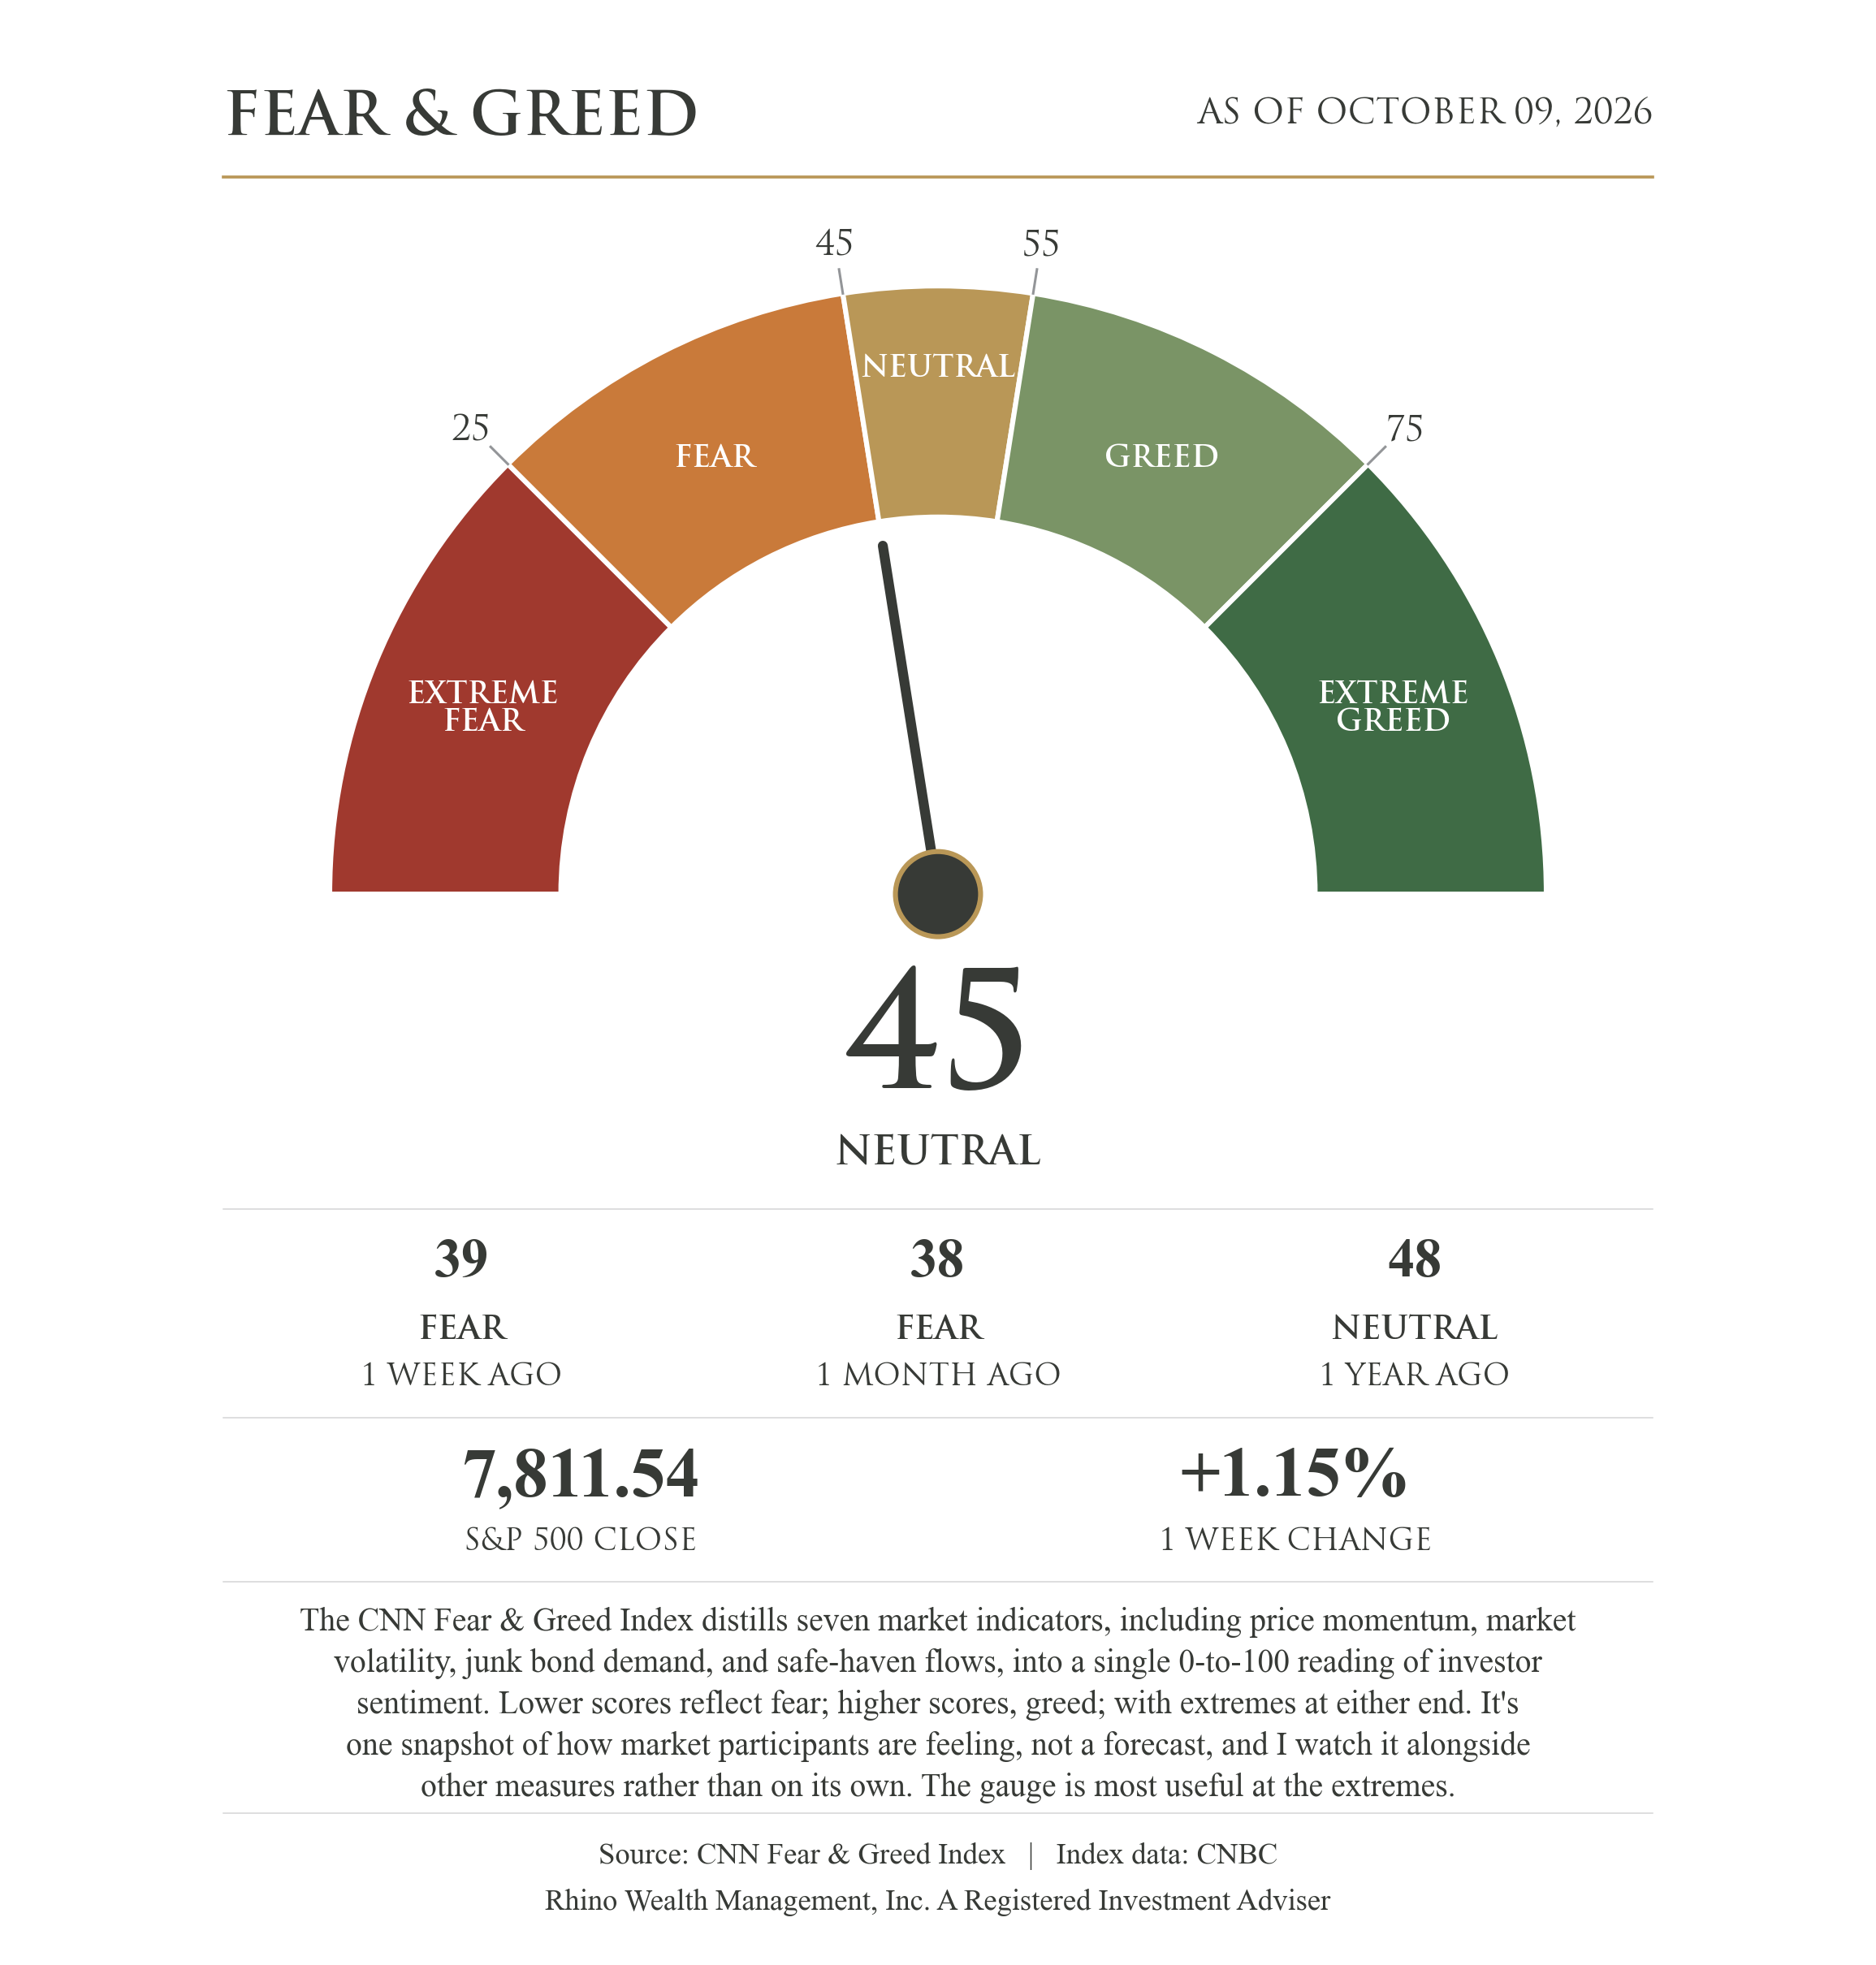
Investor sentiment moved from fear to neutral this week, rising to 45 from 39 as the S&P 500 set a new record. That's a sharp contrast with households, whose view of current conditions just hit an all-time low. In the middle of its range, the gauge isn't sending a signal either way.
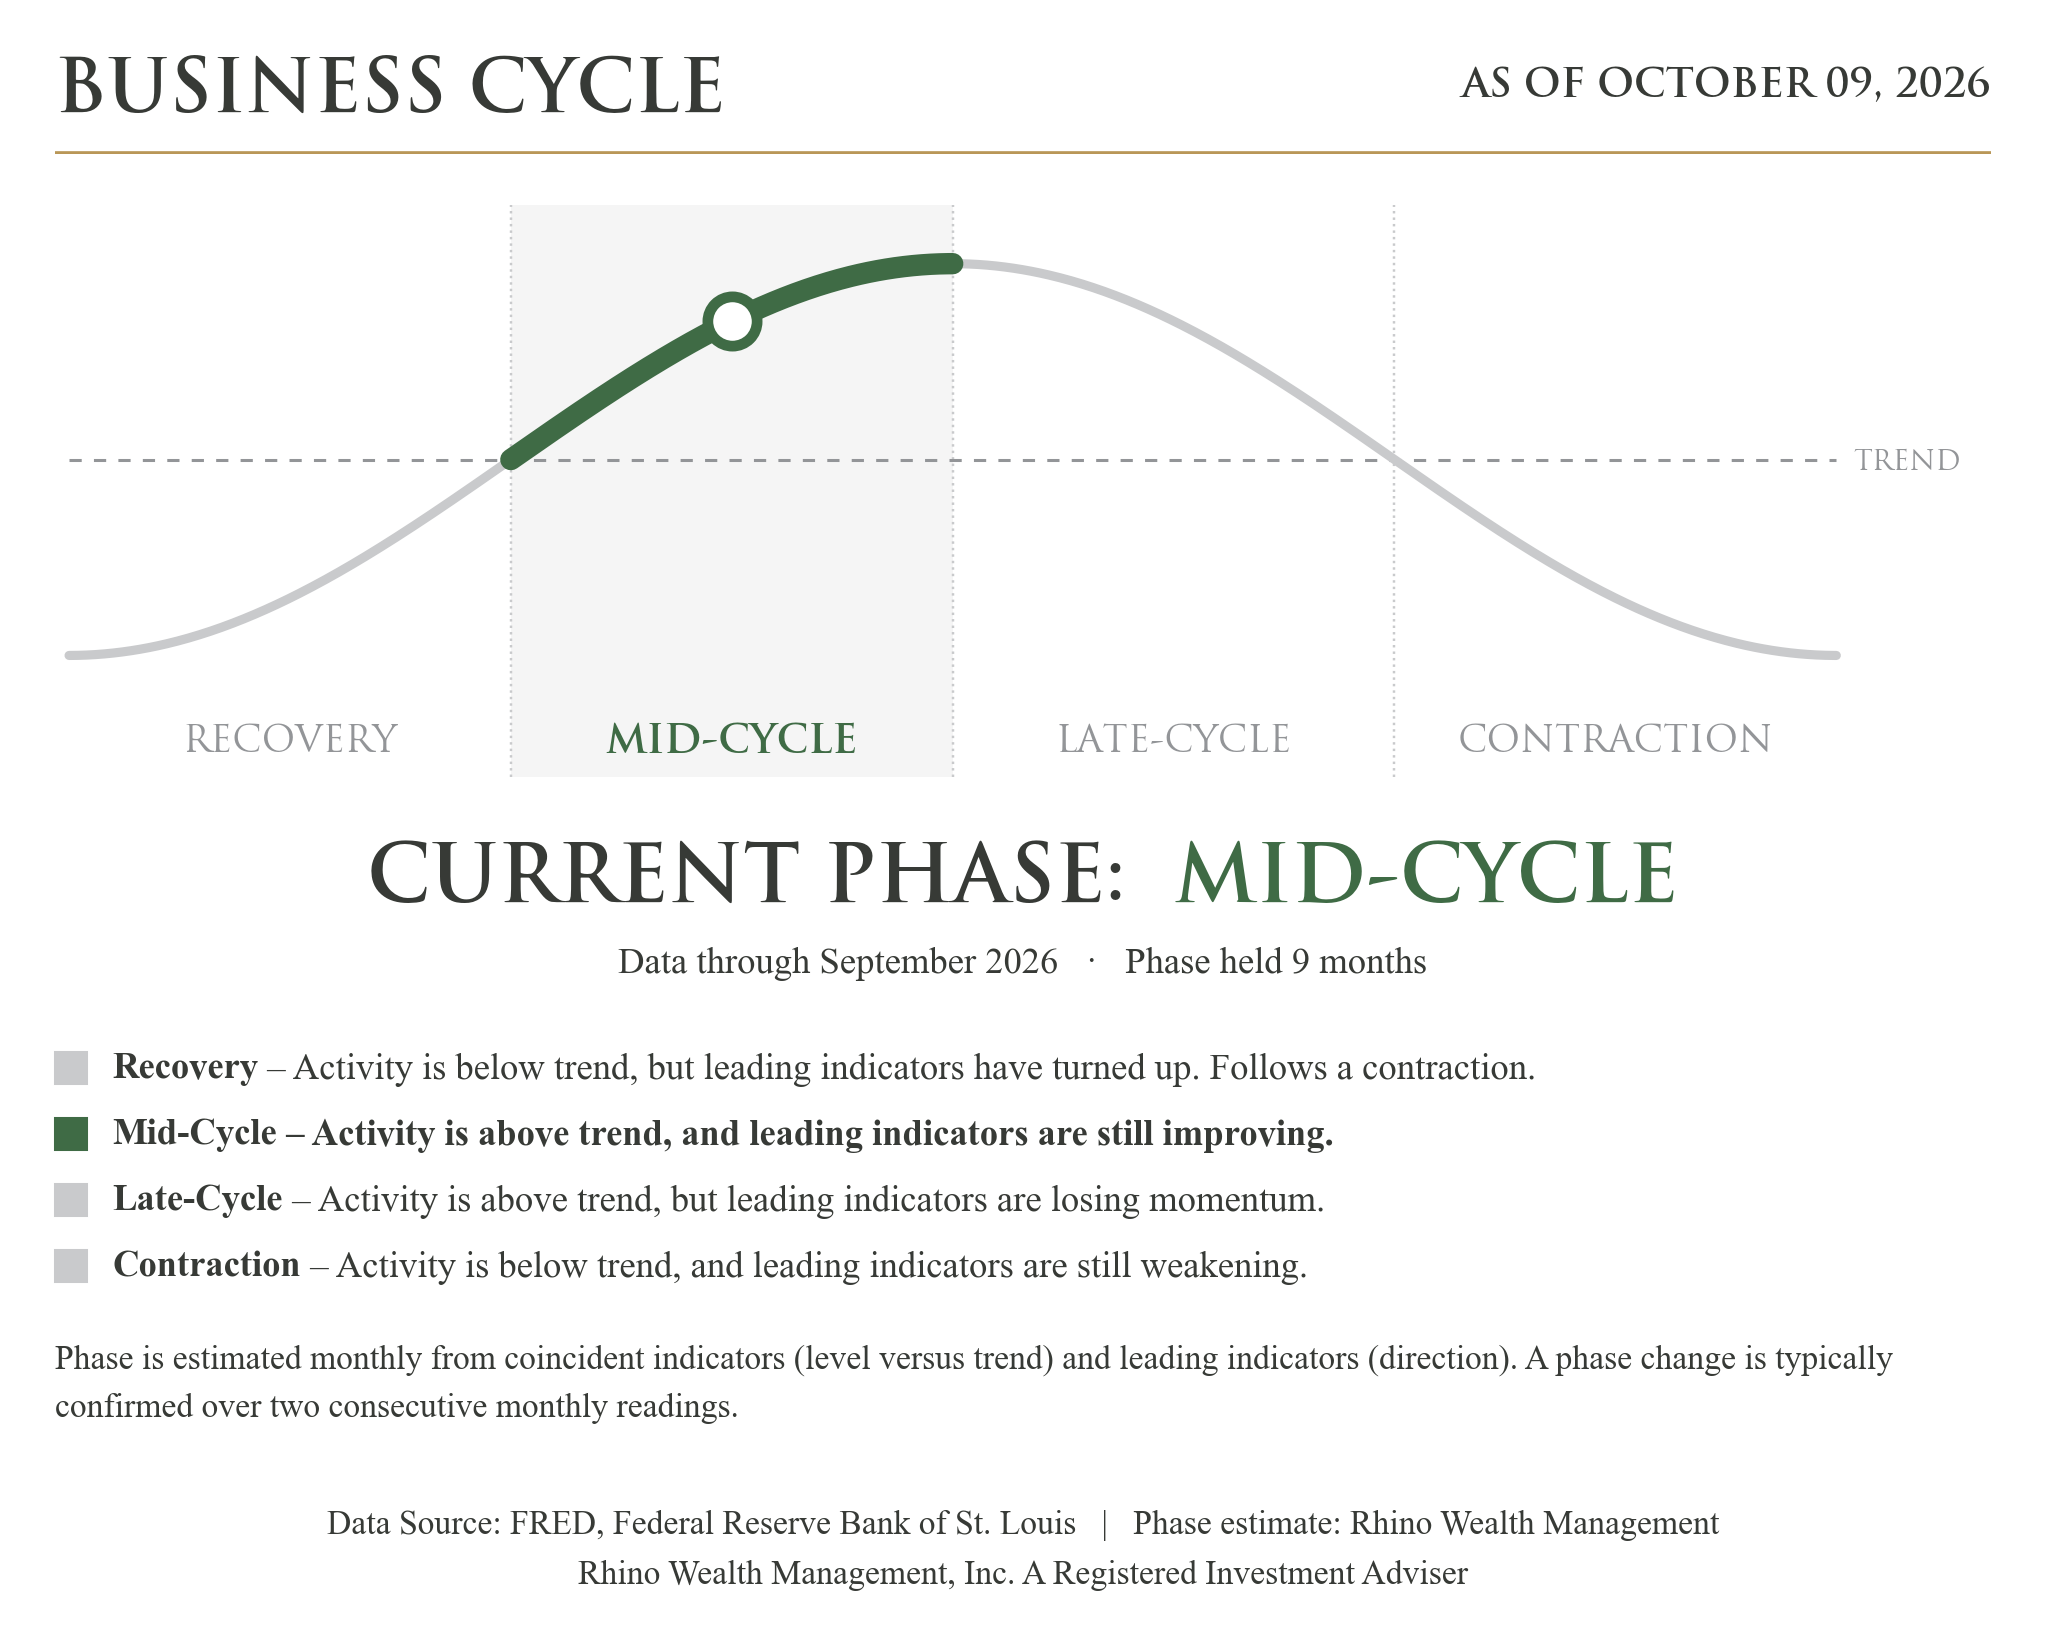
My business cycle model reads mid-cycle for a ninth straight month. Despite the gloomy headlines and near-record-low consumer sentiment, the numbers that measure actual activity say the economy is doing well. Growth is running above trend, and the indicators that tend to turn first are still improving.
Next week, I'll be watching Wednesday's September inflation report and Thursday's retail sales, the last reads on prices and spending before the Fed meets on October 28. Third-quarter earnings season also gets underway with the big banks. With stock prices resting on expected profits, I'll be listening closely to what companies say about the months ahead.
Disclosure:
This material is provided by Todd Van Der Meid, MBA, CFP®, through Rhino Wealth Management, Inc., a Registered Investment Adviser, solely for informational purposes. It is not intended as investment, tax, legal, or accounting advice. Investors should consult qualified professionals before making financial decisions.
Opinions expressed herein are general in nature and not tailored to individual circumstances. Investment strategies discussed may not be suitable for every investor. All investments carry risk, including possible loss of principal, and past performance does not guarantee future results. No investment strategy or risk management technique ensures profit or eliminates risk in all market conditions.
Investments in foreign or emerging markets involve additional risk, such as currency fluctuations, geopolitical instability, and varying accounting standards. Sector-specific investments can be more volatile due to their concentrated nature. References to indexes are for illustrative purposes; indexes are unmanaged, cannot be invested into directly, and their performance does not reflect fees, expenses, or sales charges. Index performance is not indicative of specific investment performance.
Economic forecasts and forward-looking statements reflect current views and assumptions and are subject to change. Actual results may vary materially due to market or other conditions. There is no obligation to update forward-looking information.
Information presented herein comes from reliable third-party sources but is not guaranteed for accuracy or completeness. Rhino Wealth Management, Inc. disclaims liability for errors or omissions. Portions of this content may be generated using advanced analytical tools, including artificial intelligence, and all such content has been reviewed and validated by Todd Van Der Meid, MBA, CFP®, using proprietary quality-control measures. Rhino Wealth Management, Inc. does not directly hold securities; however, securities mentioned may be included within recommended portfolio models or held by clients. Please refer to our Form ADV for additional details regarding potential conflicts of interest.