

The S&P 500 finished the week down 0.57% as investors weighed the Fed's decision to hold rates steady and mixed earnings from companies in the technology sector. Markets are also pricing in a Democratic sweep of Congress in Tuesday's midterm elections.
Ordinarily the Federal Reserve's decision to hold interest rates steady in the face of stubborn inflation would have been the lead story, but this was not an ordinary week. Investors began asking when the spending technology companies have been making on the artificial intelligence (AI) buildout would pay off.
Several technology companies reported quarterly earnings this week, and we learned that some are free-cash-flow negative. Free cash flow is the cash a company has left after paying for its operations and investments. And still, technology companies are expected to invest more than $1 trillion next year, assuming they can get semiconductor chips and the electricity to power them. In 2026 between 30% and 50% of GDP growth was tied to companies spending on AI infrastructure. Anything that suggests that spending and growth may be slowing will weigh on markets. When companies can't fund their spending from current revenue, they have to turn to the debt markets at elevated rates, bringing the timing of future earnings into question.
Polls and prediction markets are leaning toward Democrats winning both houses of Congress in next week's midterm elections. This has implications for markets as there are calls from some on the left to halt data center construction and advanced AI development. With AI spending driving such a significant portion of GDP growth, regulatory hurdles could put further pressure on potential earnings in this sector.
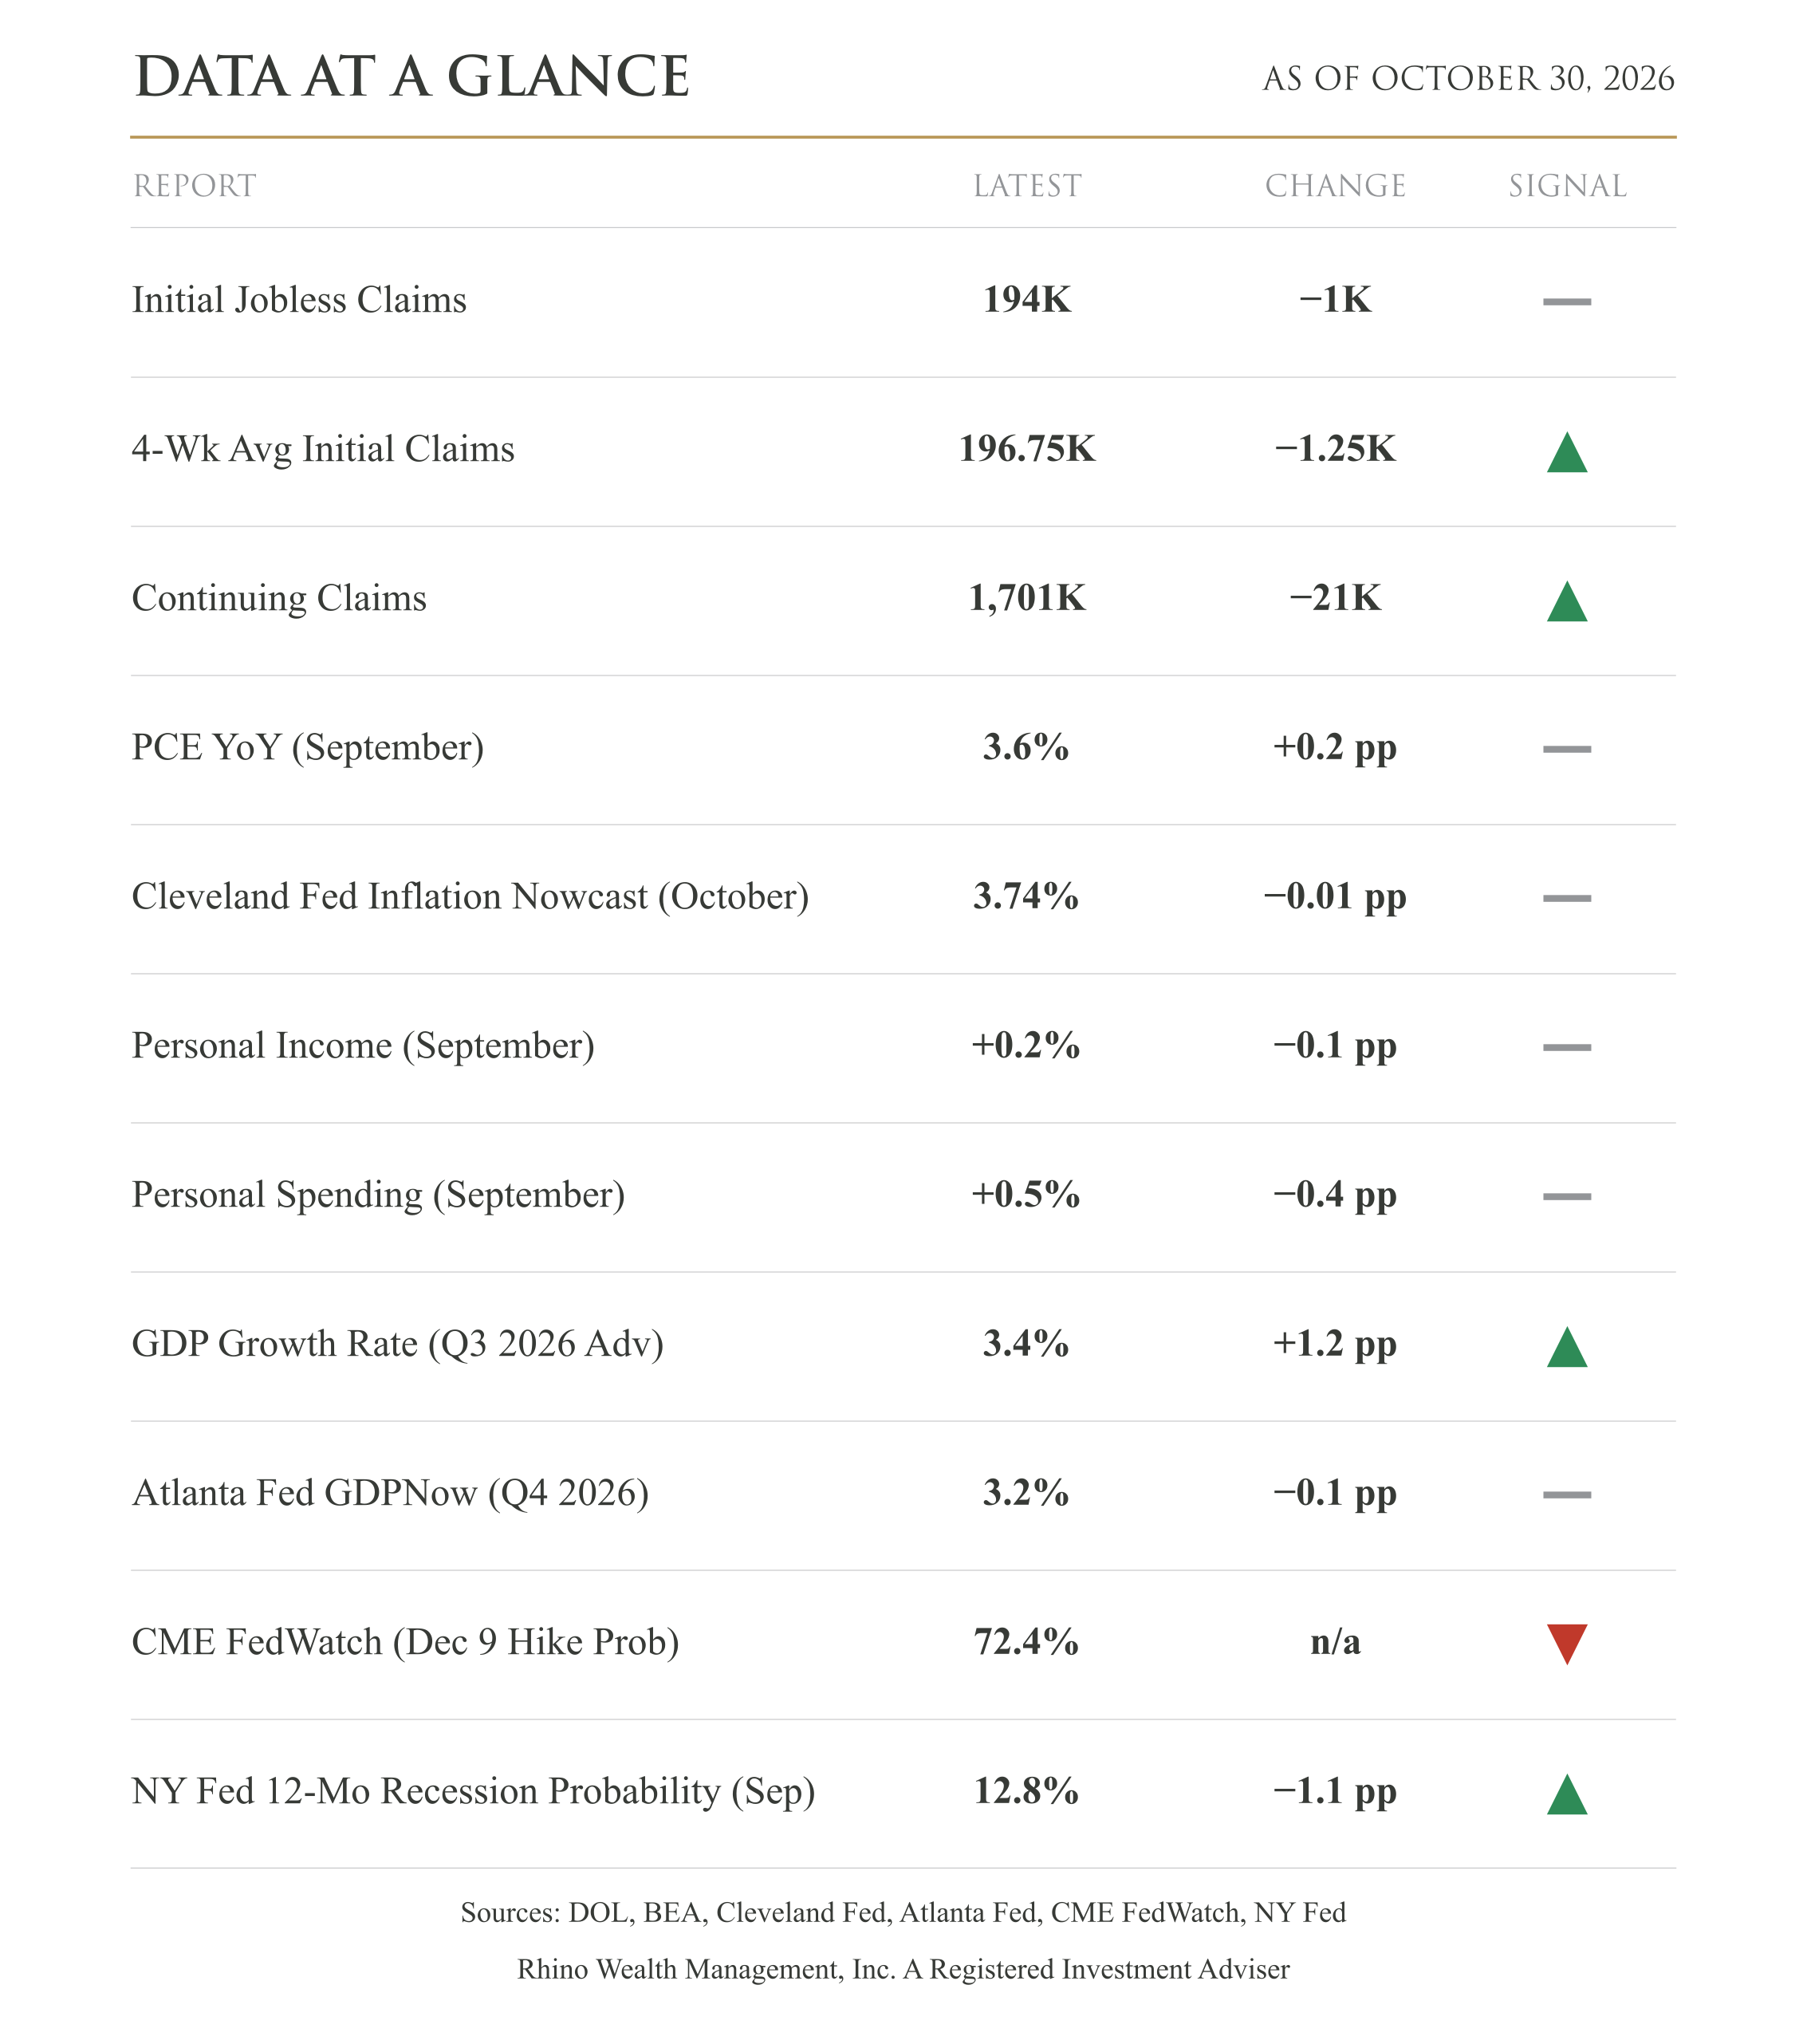
Economic growth is strong. Gross domestic product (GDP), the value of all the goods and services the economy produces, grew at a 3.4% annual rate in the third quarter (July through September). Growth in the second quarter (April through June) was revised up to 2.2% from 1.5%. The Atlanta Fed's running estimate for the fourth quarter (October through December) is 3.2%.
There's no sign of mass layoffs. The popular narrative is that AI will displace workers and lead to widespread job losses. If that were happening, initial claims for unemployment benefits would be picking up, and continuing claims, which count people still collecting benefits because they haven't found new work, would begin to rise as well. Neither is happening. Initial claims came in at 194,000 this week, about where they've been all month, and continuing claims fell by 21,000 to about 1.7 million.
Consumers are still spending. If people were worried about their jobs, you'd expect spending to start trailing off. Instead, it rose 0.5% in September while income grew 0.2%. That's the second straight month spending has outpaced income, so people are likely leaning on savings or credit to keep it going.
Inflation is the real concern. The Fed's preferred inflation gauge, the personal consumption expenditures (PCE) price index, was up 3.6% from a year earlier in September, compared with 3.4% in August. The Cleveland Fed's estimate for October consumer prices points to about 3.7%. Historically, the Fed has responded to inflation by raising rates, and it has often raised them high enough to slow the economy into a recession. The Fed raised rates in September and is expected to raise them again in December. I see that as a risk, but one that's further down the road.
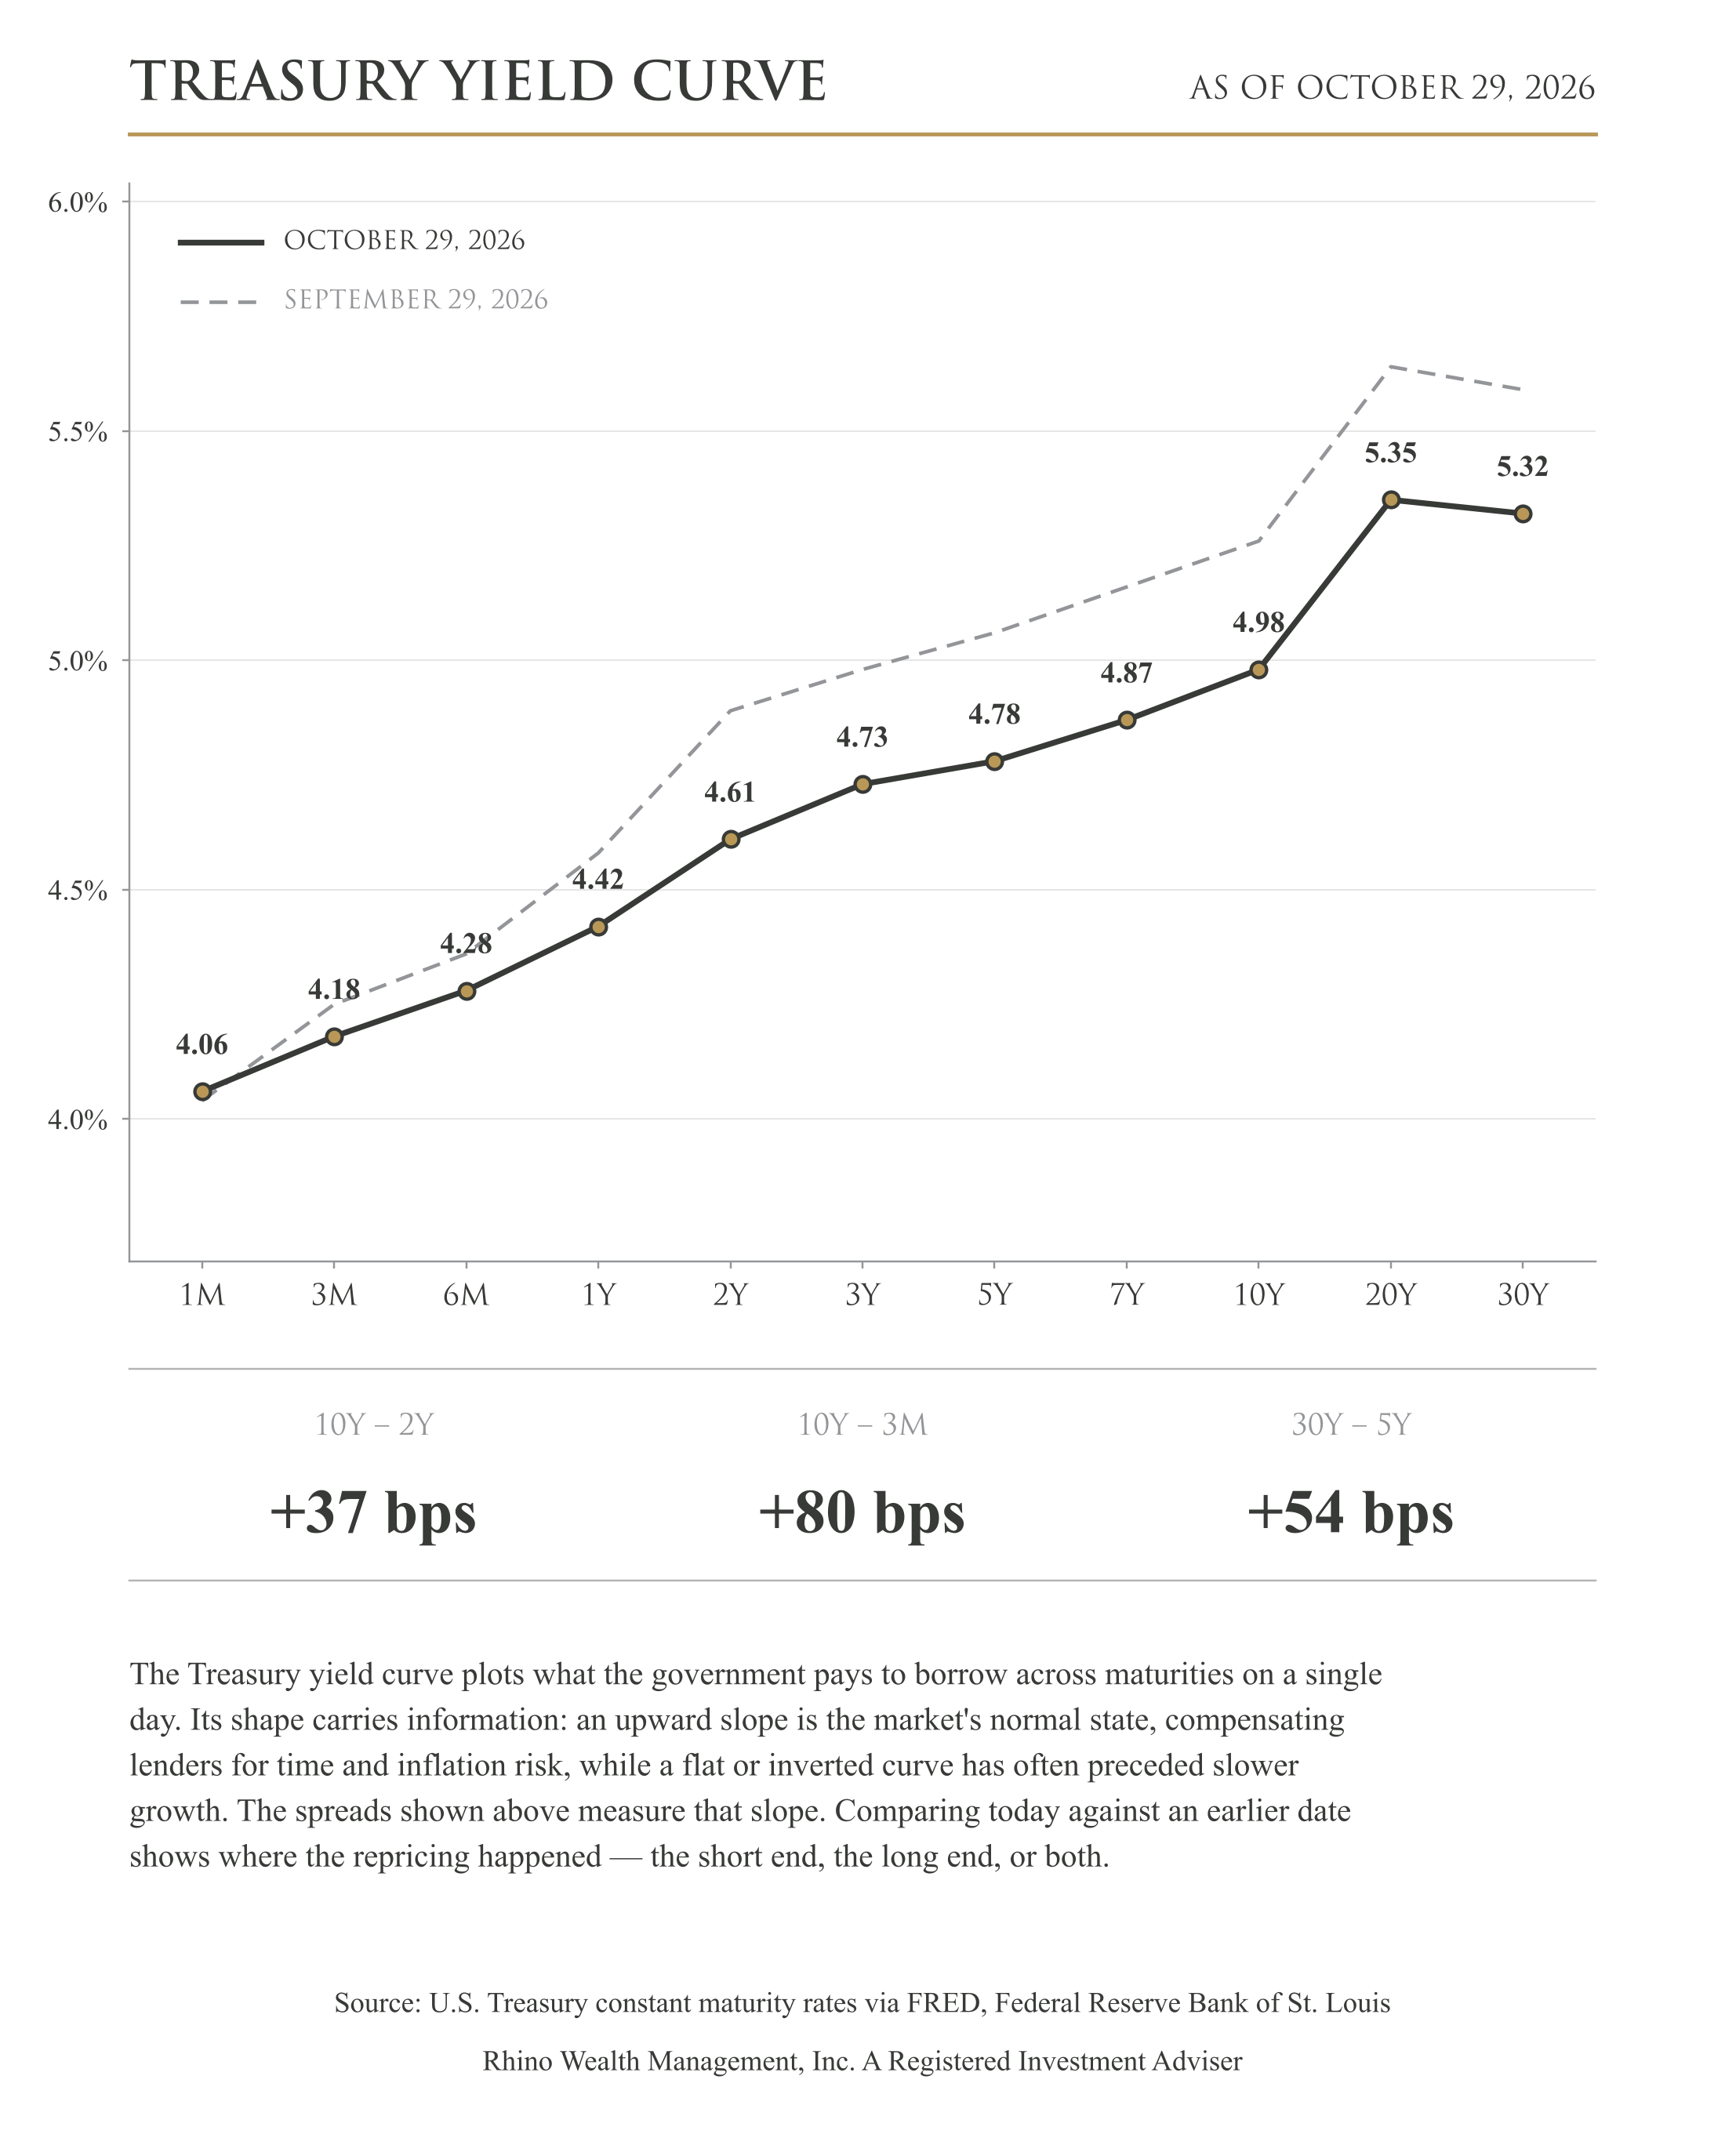
Interest rates on government bonds fell over the past month. Yields on maturities from two years out to 30 years dropped by roughly a quarter of a percentage point, while short-term rates barely moved. The curve still slopes upward, with the 10-year yield 0.37 percentage points above the 2-year. That’s its normal shape, not the inverted pattern that has often come before a recession.
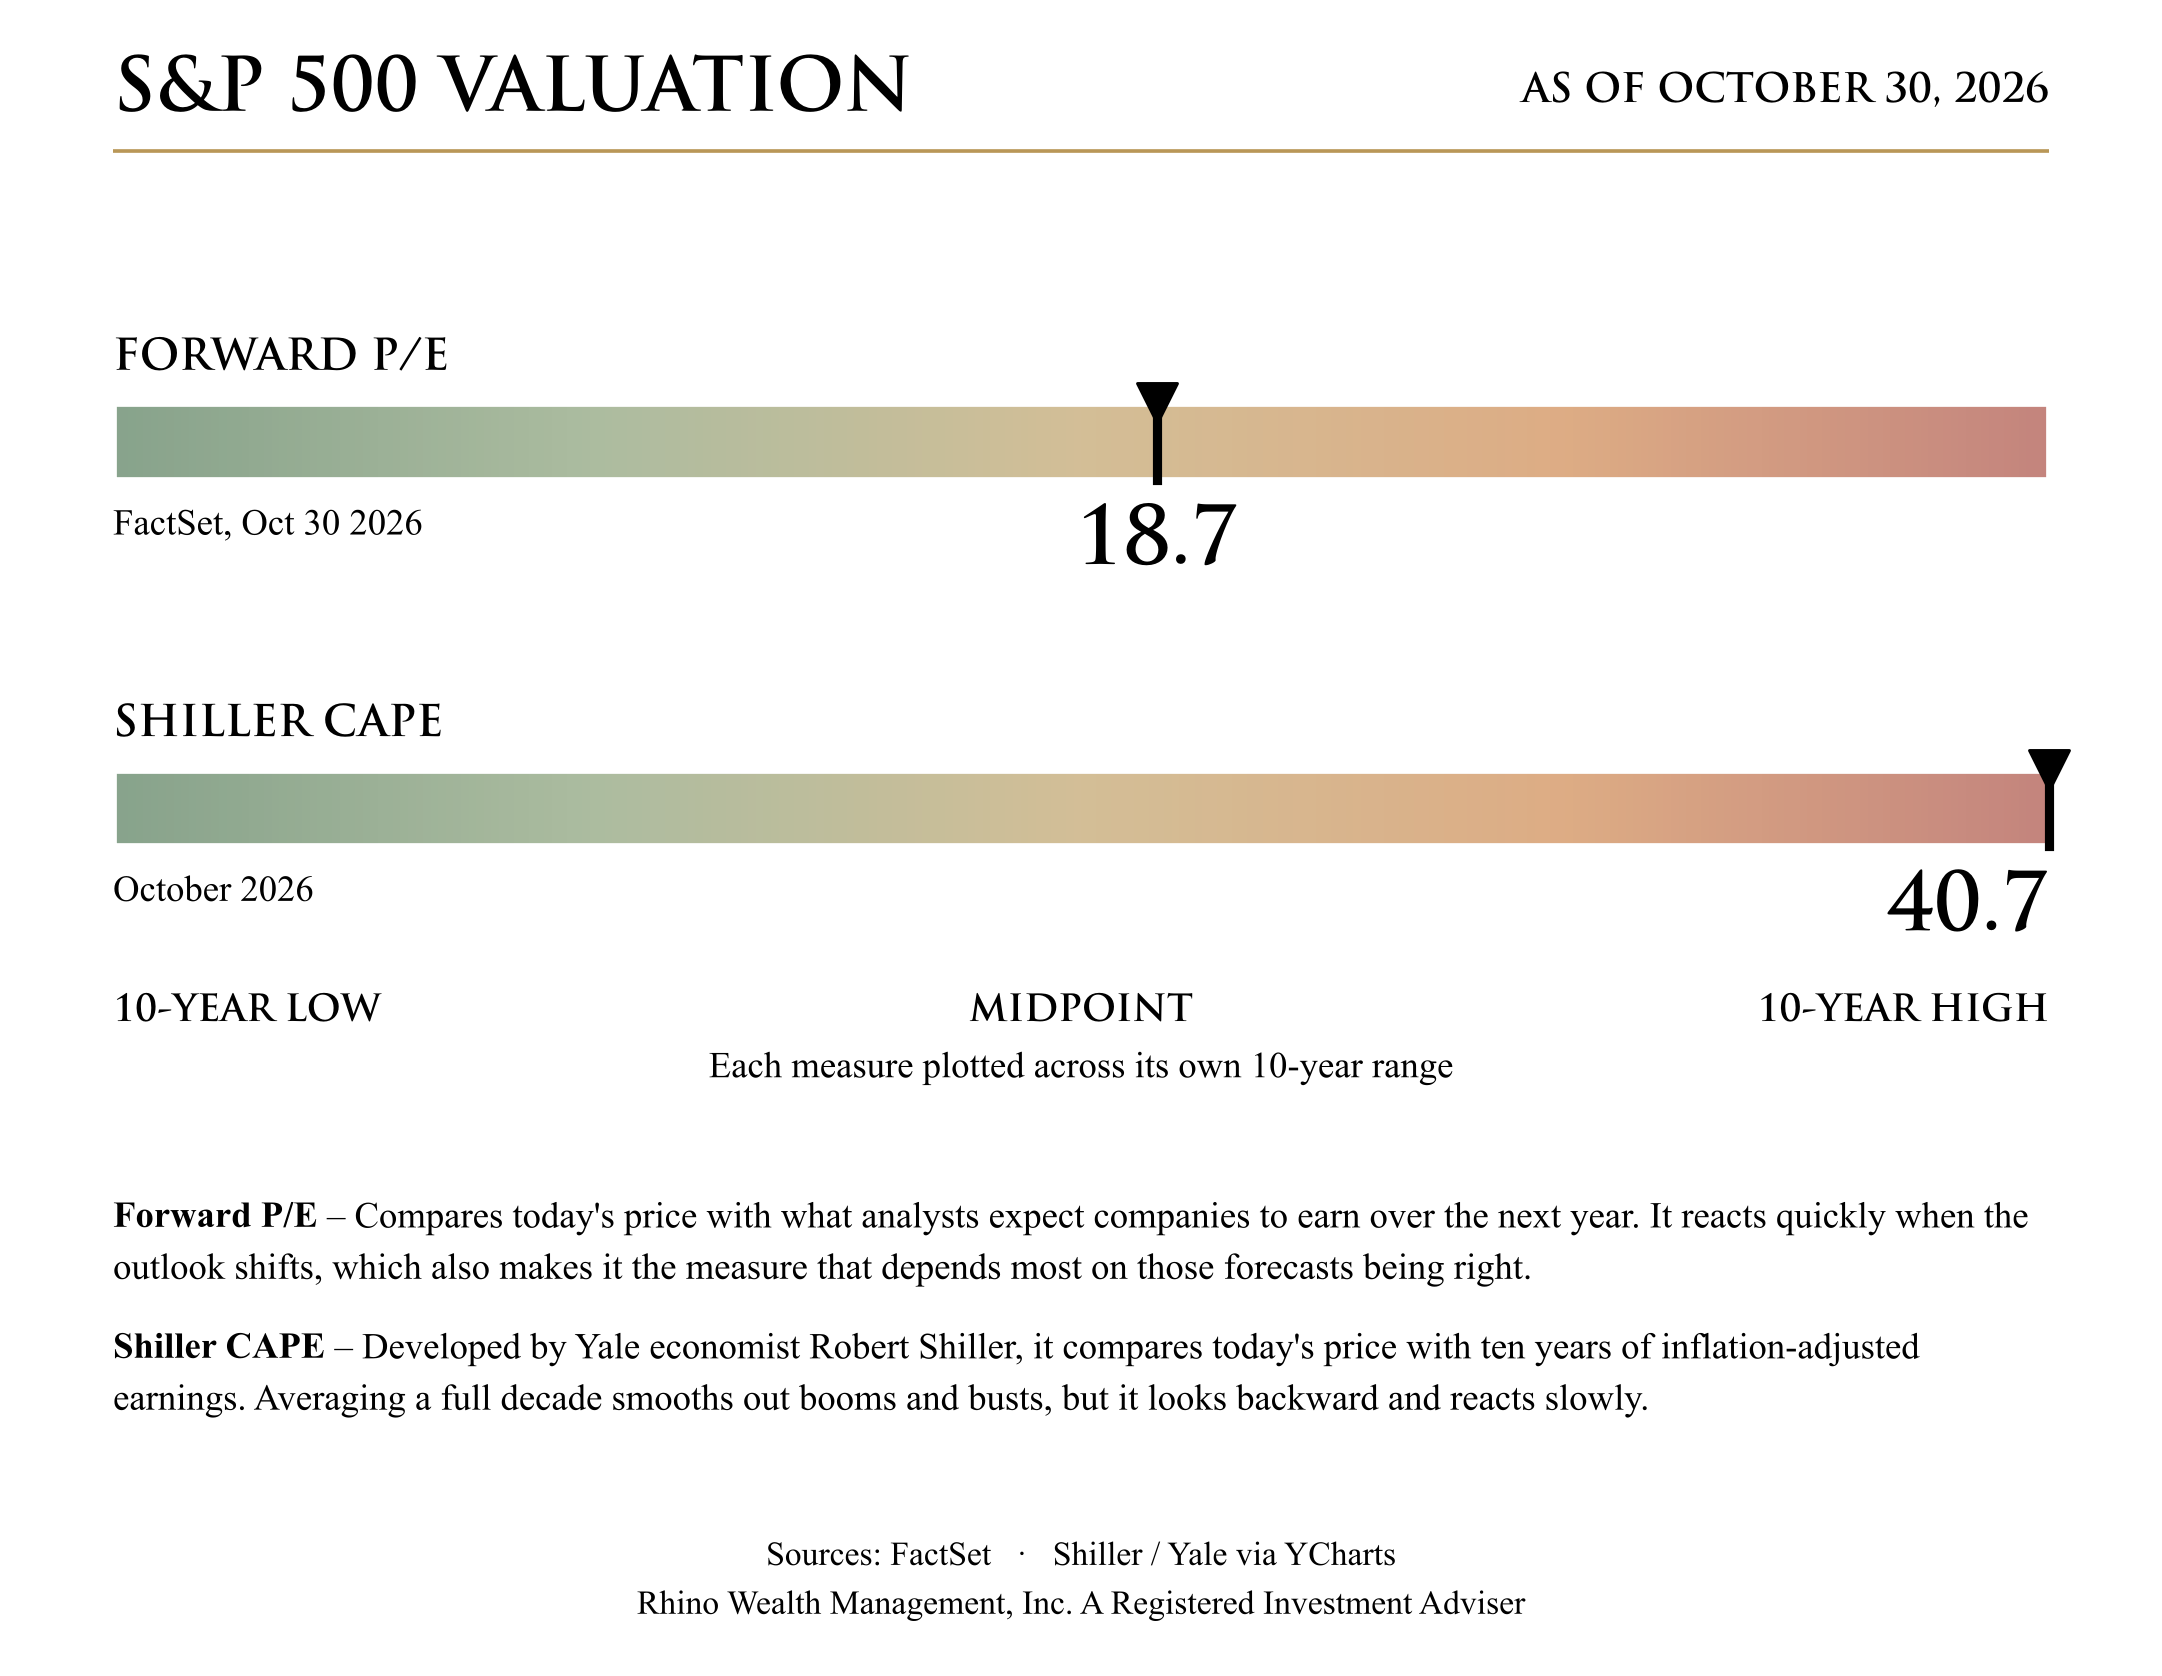
Lower prices do have an upside: stocks get cheaper relative to what companies are expected to earn. The forward price-to-earnings ratio, which compares the S&P 500’s price with analysts’ earnings forecasts for the next year, is at 18.7, near the middle of its 10-year range. That only holds as long as earnings estimates hold. If questions about AI spending lead analysts to cut their forecasts, the market will look more expensive than this number suggests.
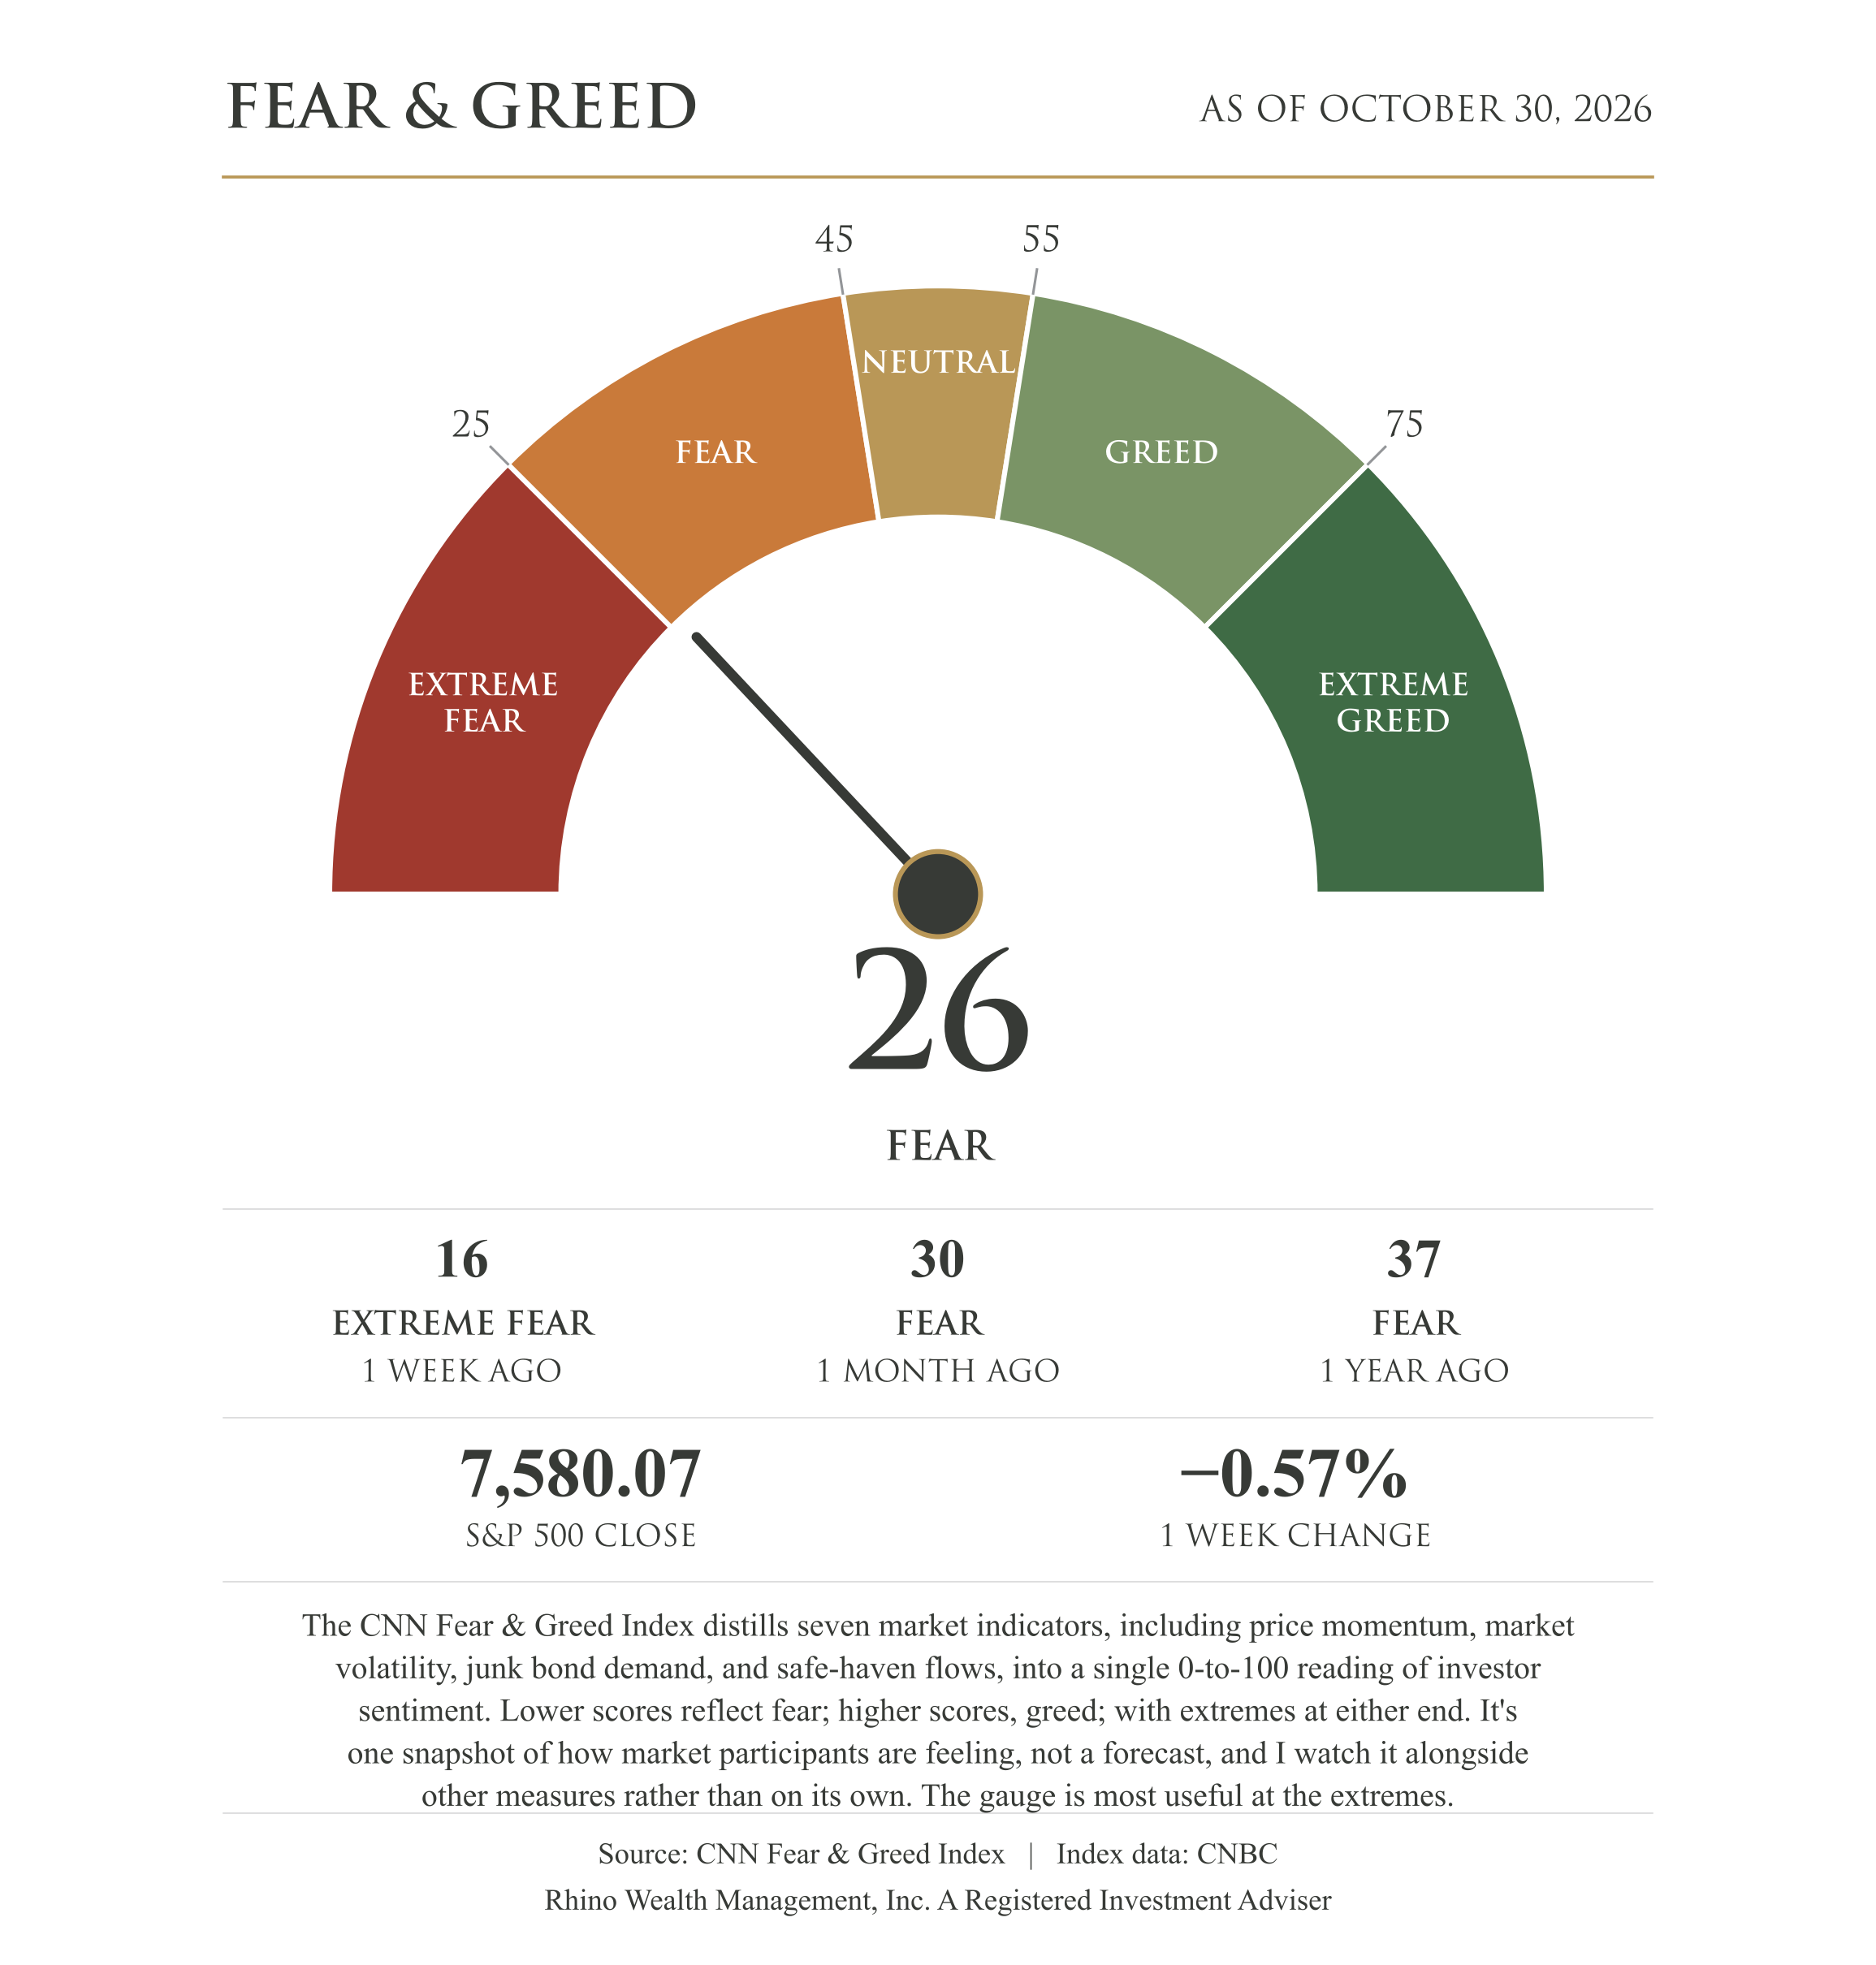
Investor sentiment edged up to 26 from 16, moving out of extreme fear and back into fear even as stocks fell. It has stayed in fear territory for at least a month. The gauge is most useful at the extremes, so I’m not reading much into the move.
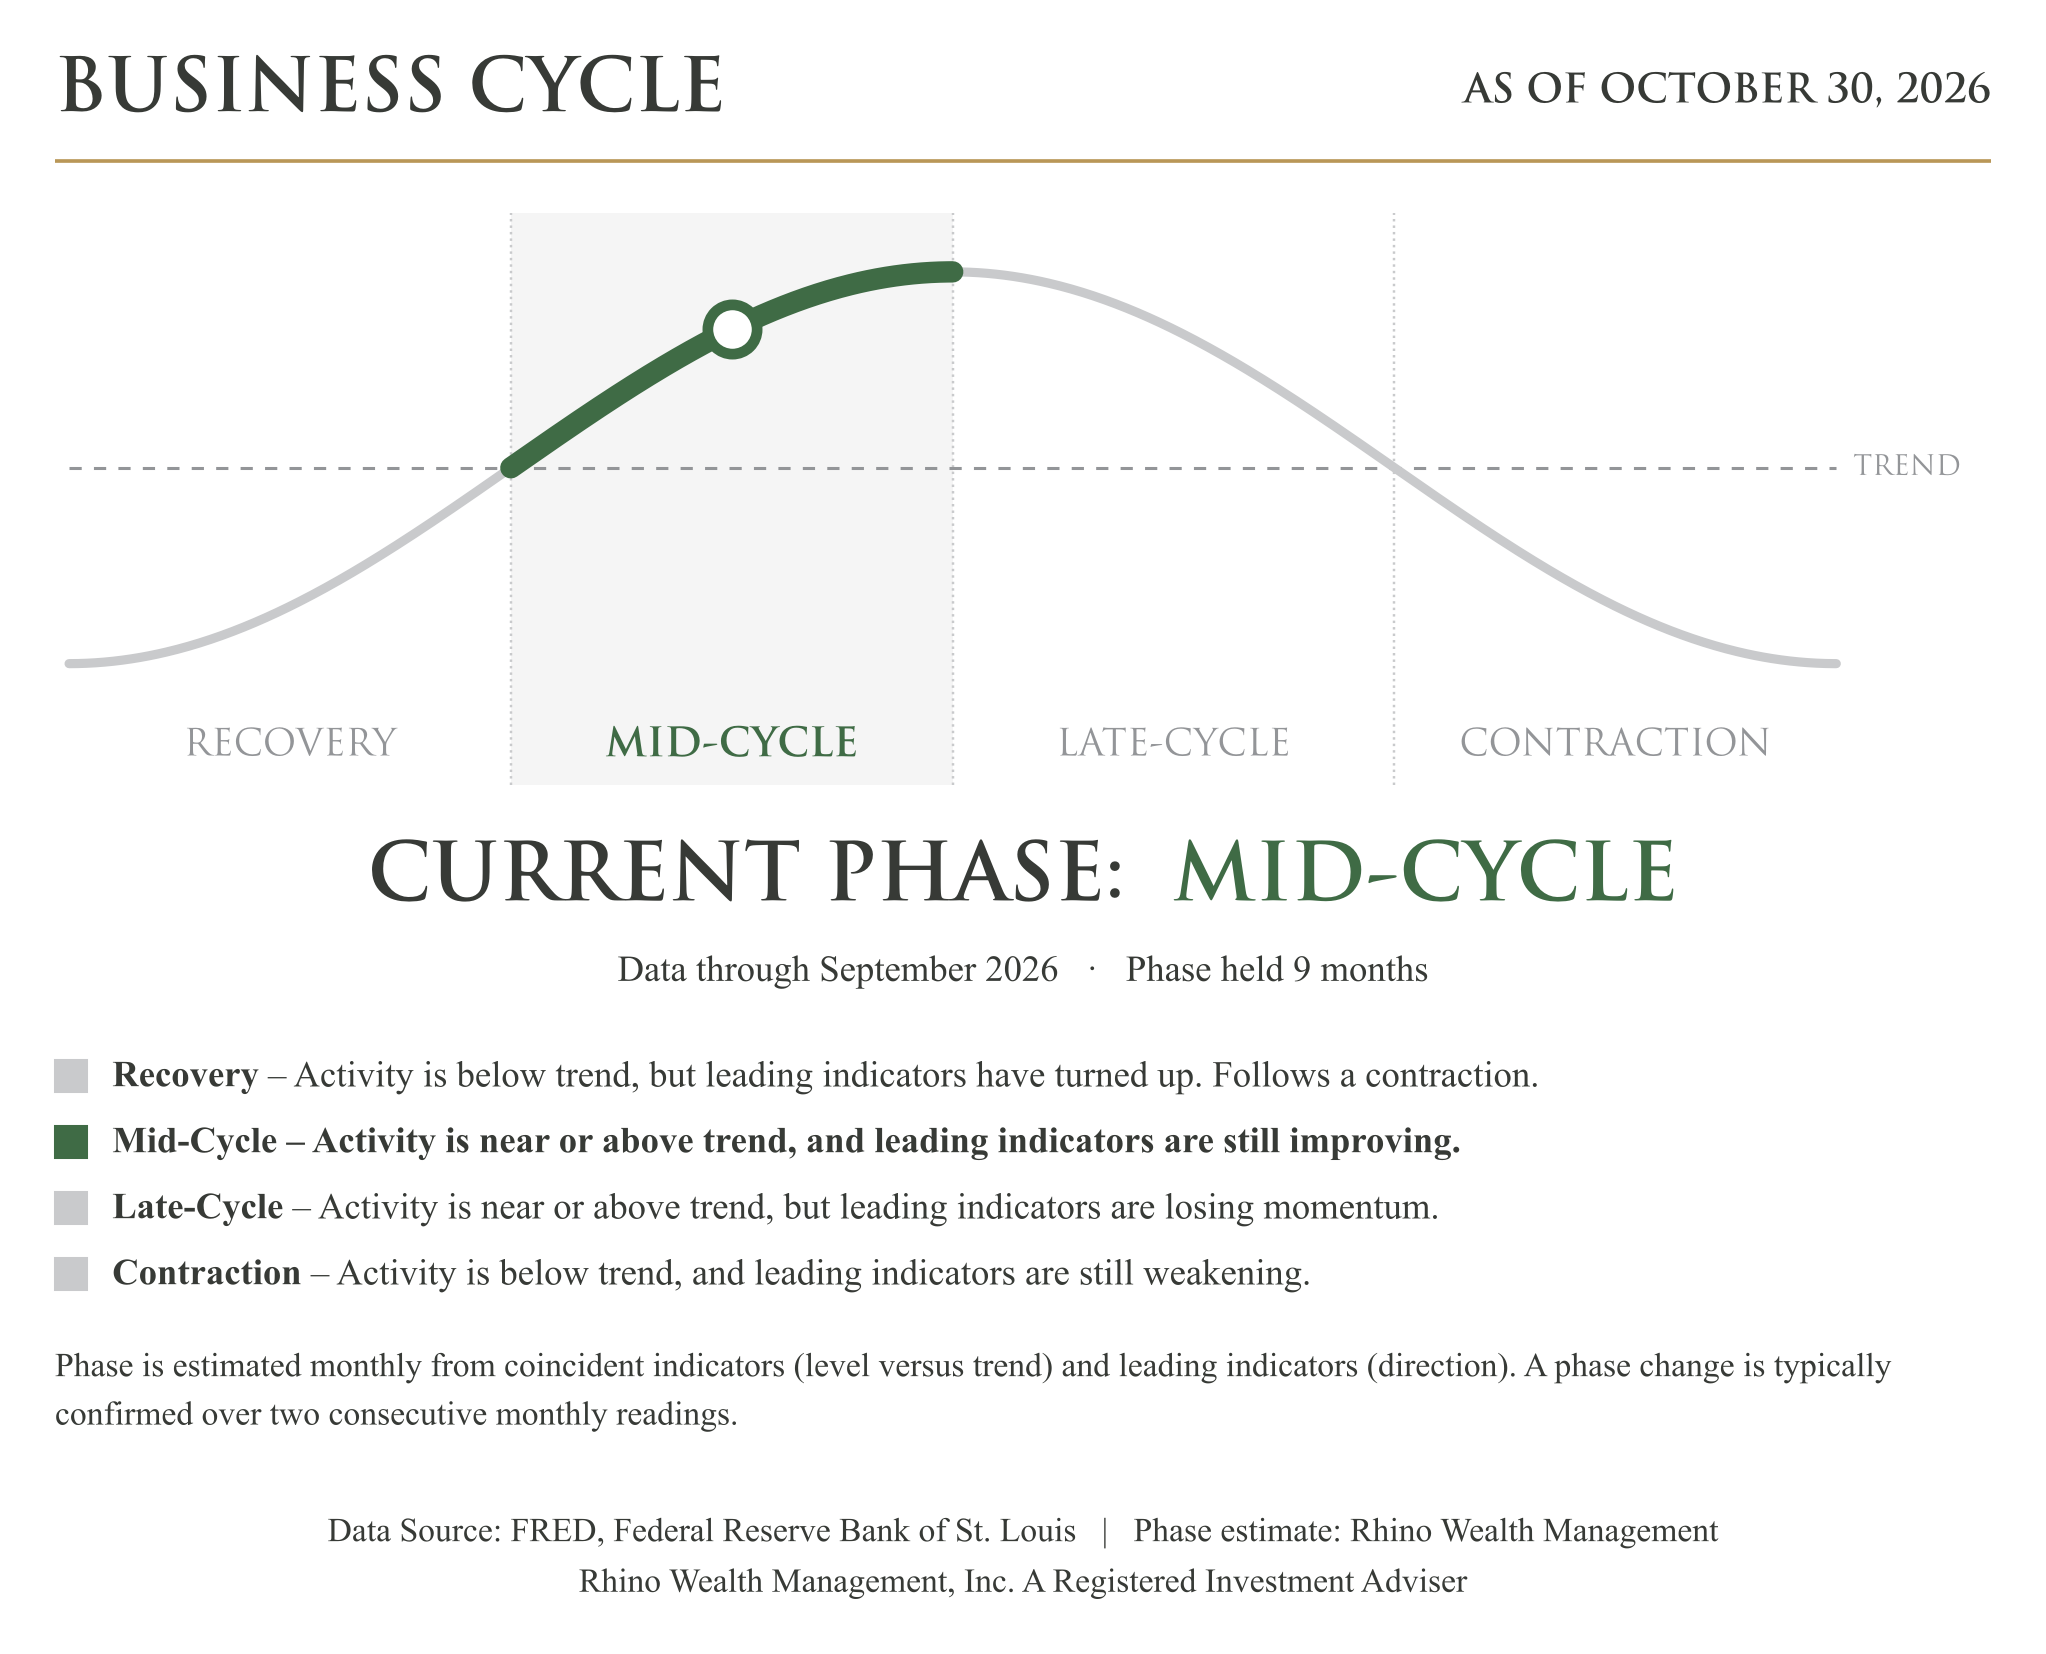
My business cycle model still reads mid-cycle, where it has been for nine months. That means economic activity is above its long-term trend, and the indicators that tend to lead the economy are still improving. It’s an estimate built from data through September, so it tells us where the economy stood most recently. It isn’t a forecast of where the economy is headed or where markets might go.
What I’m watching from here: the midterm elections on November 3, the October jobs report on November 6, and the October inflation report on November 10. Each will shape what the Fed does at its December 9 meeting.
Disclosure:
This material is provided by Todd Van Der Meid, MBA, CFP®, through Rhino Wealth Management, Inc., a Registered Investment Adviser, solely for informational purposes. It is not intended as investment, tax, legal, or accounting advice. Investors should consult qualified professionals before making financial decisions.
Opinions expressed herein are general in nature and not tailored to individual circumstances. Investment strategies discussed may not be suitable for every investor. All investments carry risk, including possible loss of principal, and past performance does not guarantee future results. No investment strategy or risk management technique ensures profit or eliminates risk in all market conditions.
Investments in foreign or emerging markets involve additional risk, such as currency fluctuations, geopolitical instability, and varying accounting standards. Sector-specific investments can be more volatile due to their concentrated nature. References to indexes are for illustrative purposes; indexes are unmanaged, cannot be invested into directly, and their performance does not reflect fees, expenses, or sales charges. Index performance is not indicative of specific investment performance.
Economic forecasts and forward-looking statements reflect current views and assumptions and are subject to change. Actual results may vary materially due to market or other conditions. There is no obligation to update forward-looking information.
Information presented herein comes from reliable third-party sources but is not guaranteed for accuracy or completeness. Rhino Wealth Management, Inc. disclaims liability for errors or omissions. Portions of this content may be generated using advanced analytical tools, including artificial intelligence, and all such content has been reviewed and validated by Todd Van Der Meid, MBA, CFP®, using proprietary quality-control measures. Rhino Wealth Management, Inc. does not directly hold securities; however, securities mentioned may be included within recommended portfolio models or held by clients. Please refer to our Form ADV for additional details regarding potential conflicts of interest.