

More Red Arrows than Usual
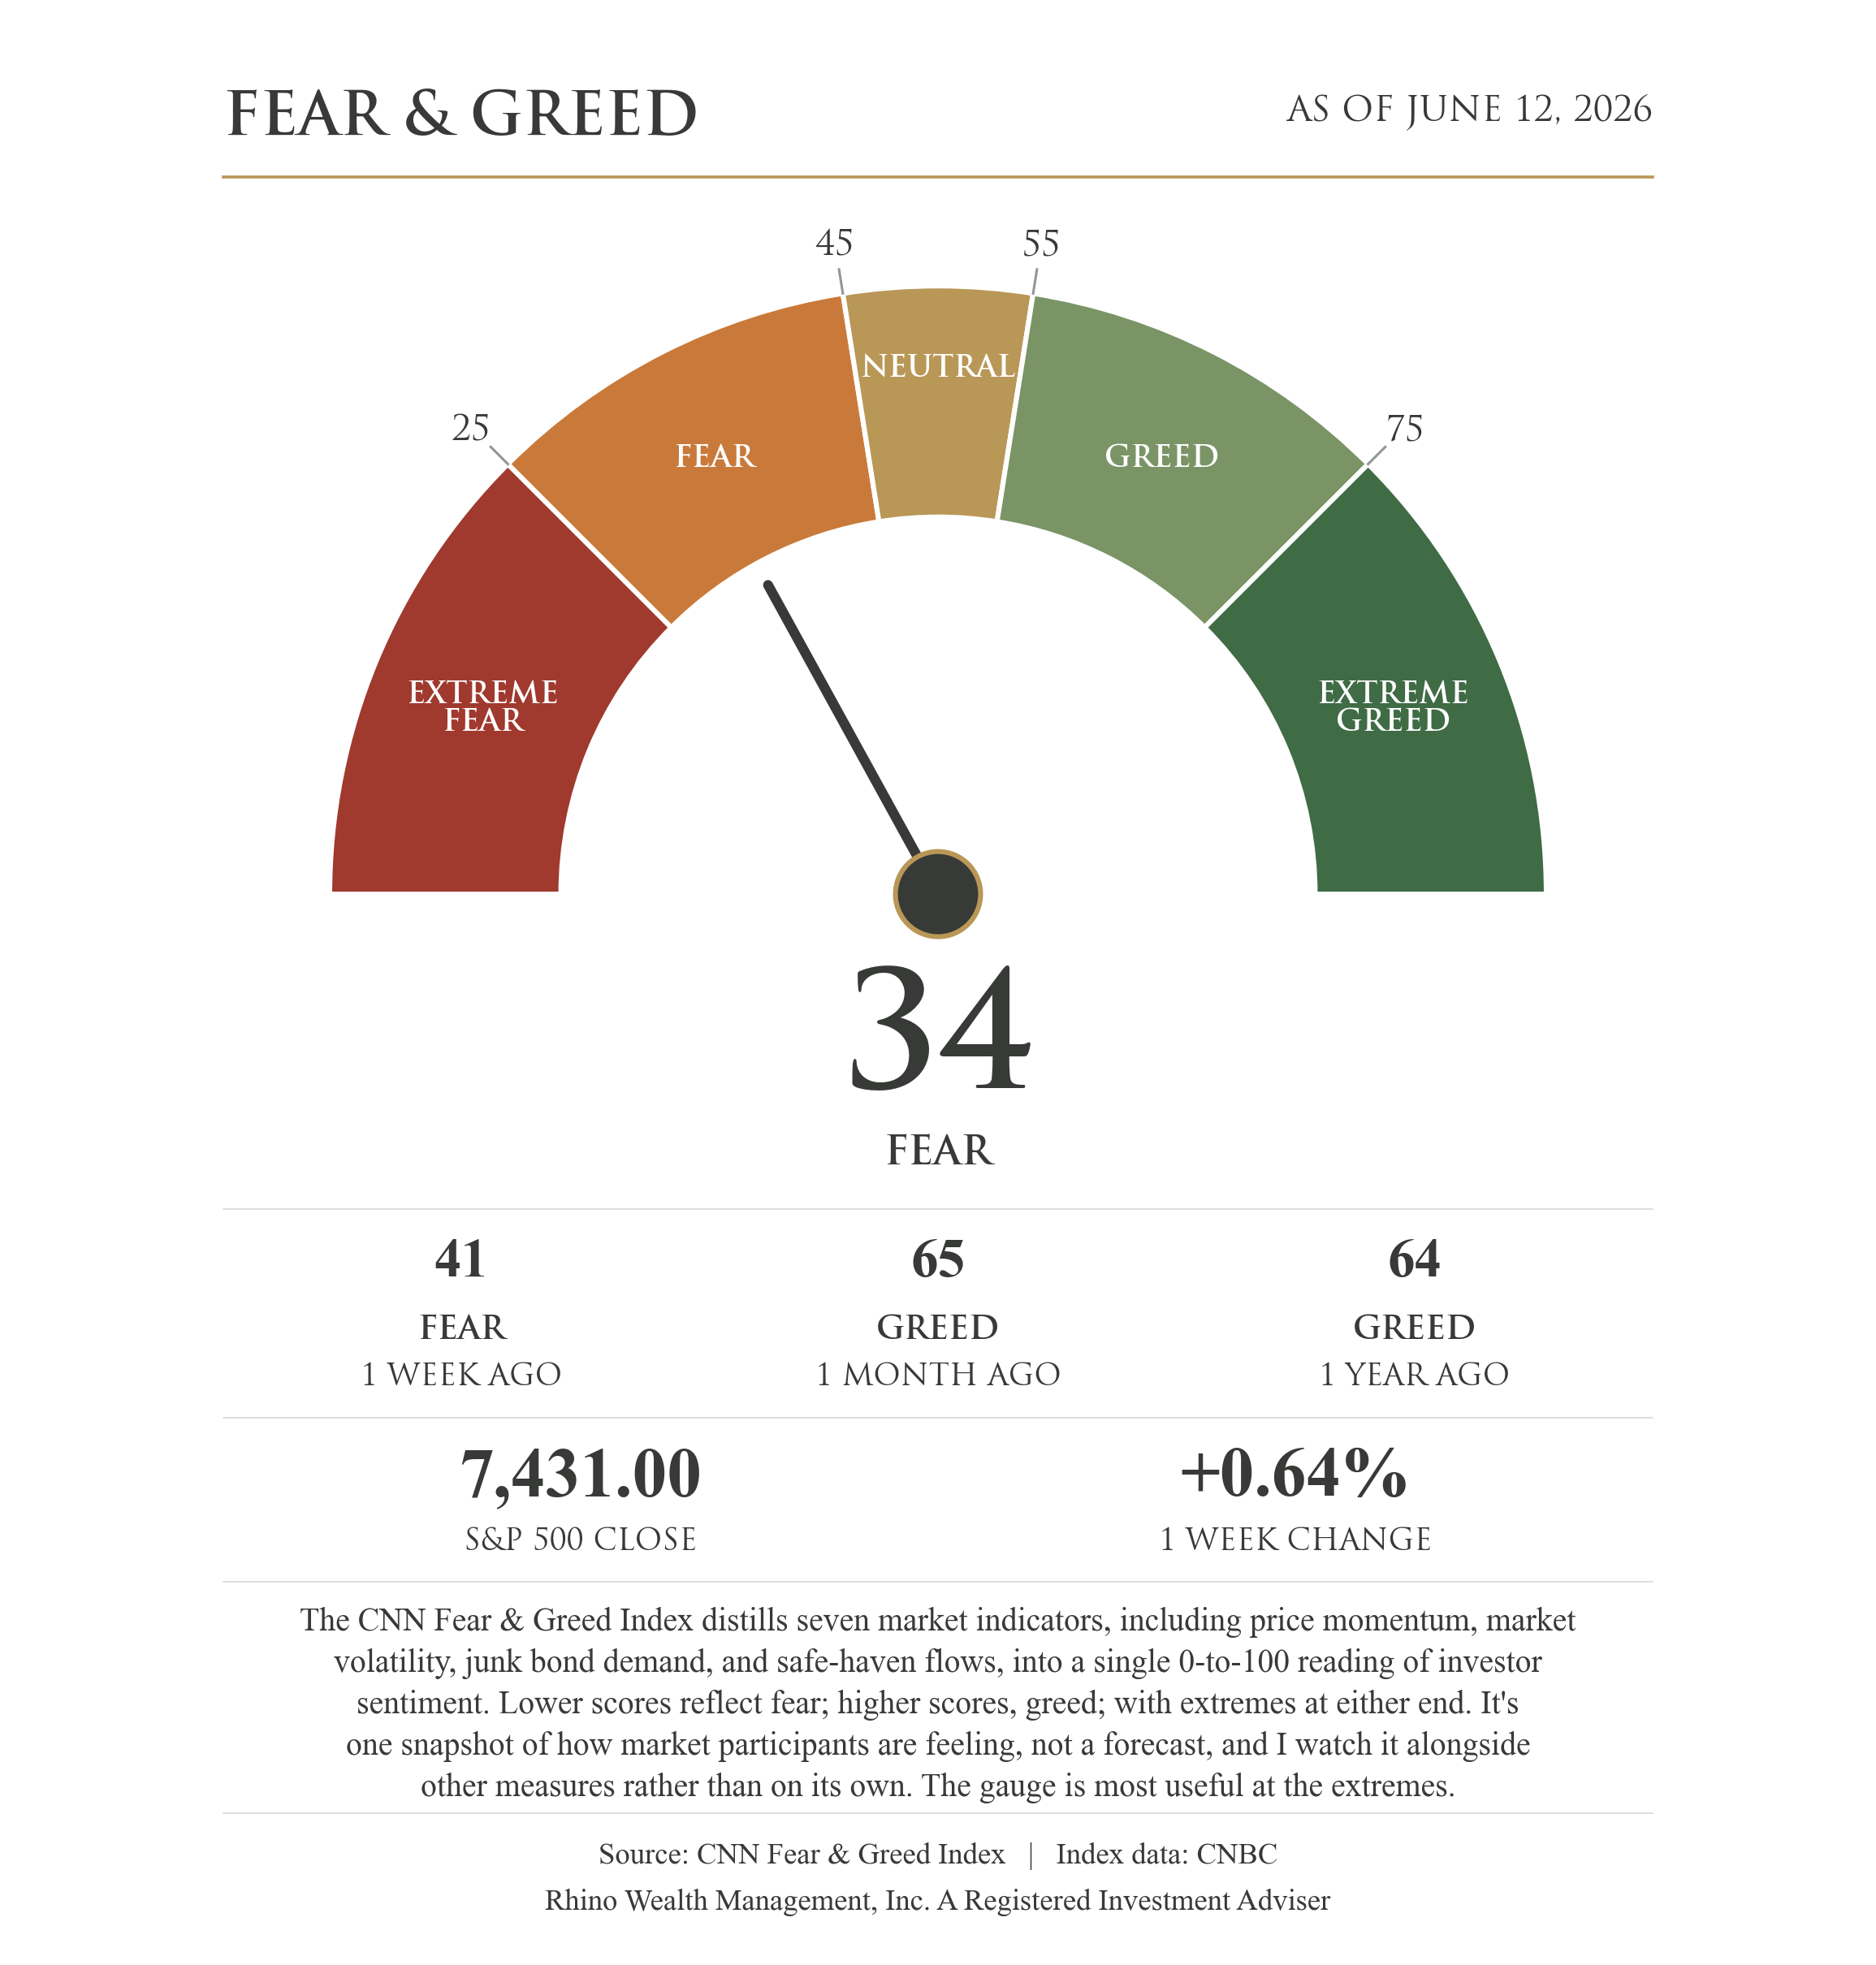
The S&P 500 closed out a volatile week up 0.64%, driven by a hot inflation report and whipsaw news on the war in Iran, which swung from a full return to military action to the certainty of a signed peace deal. Time will tell.
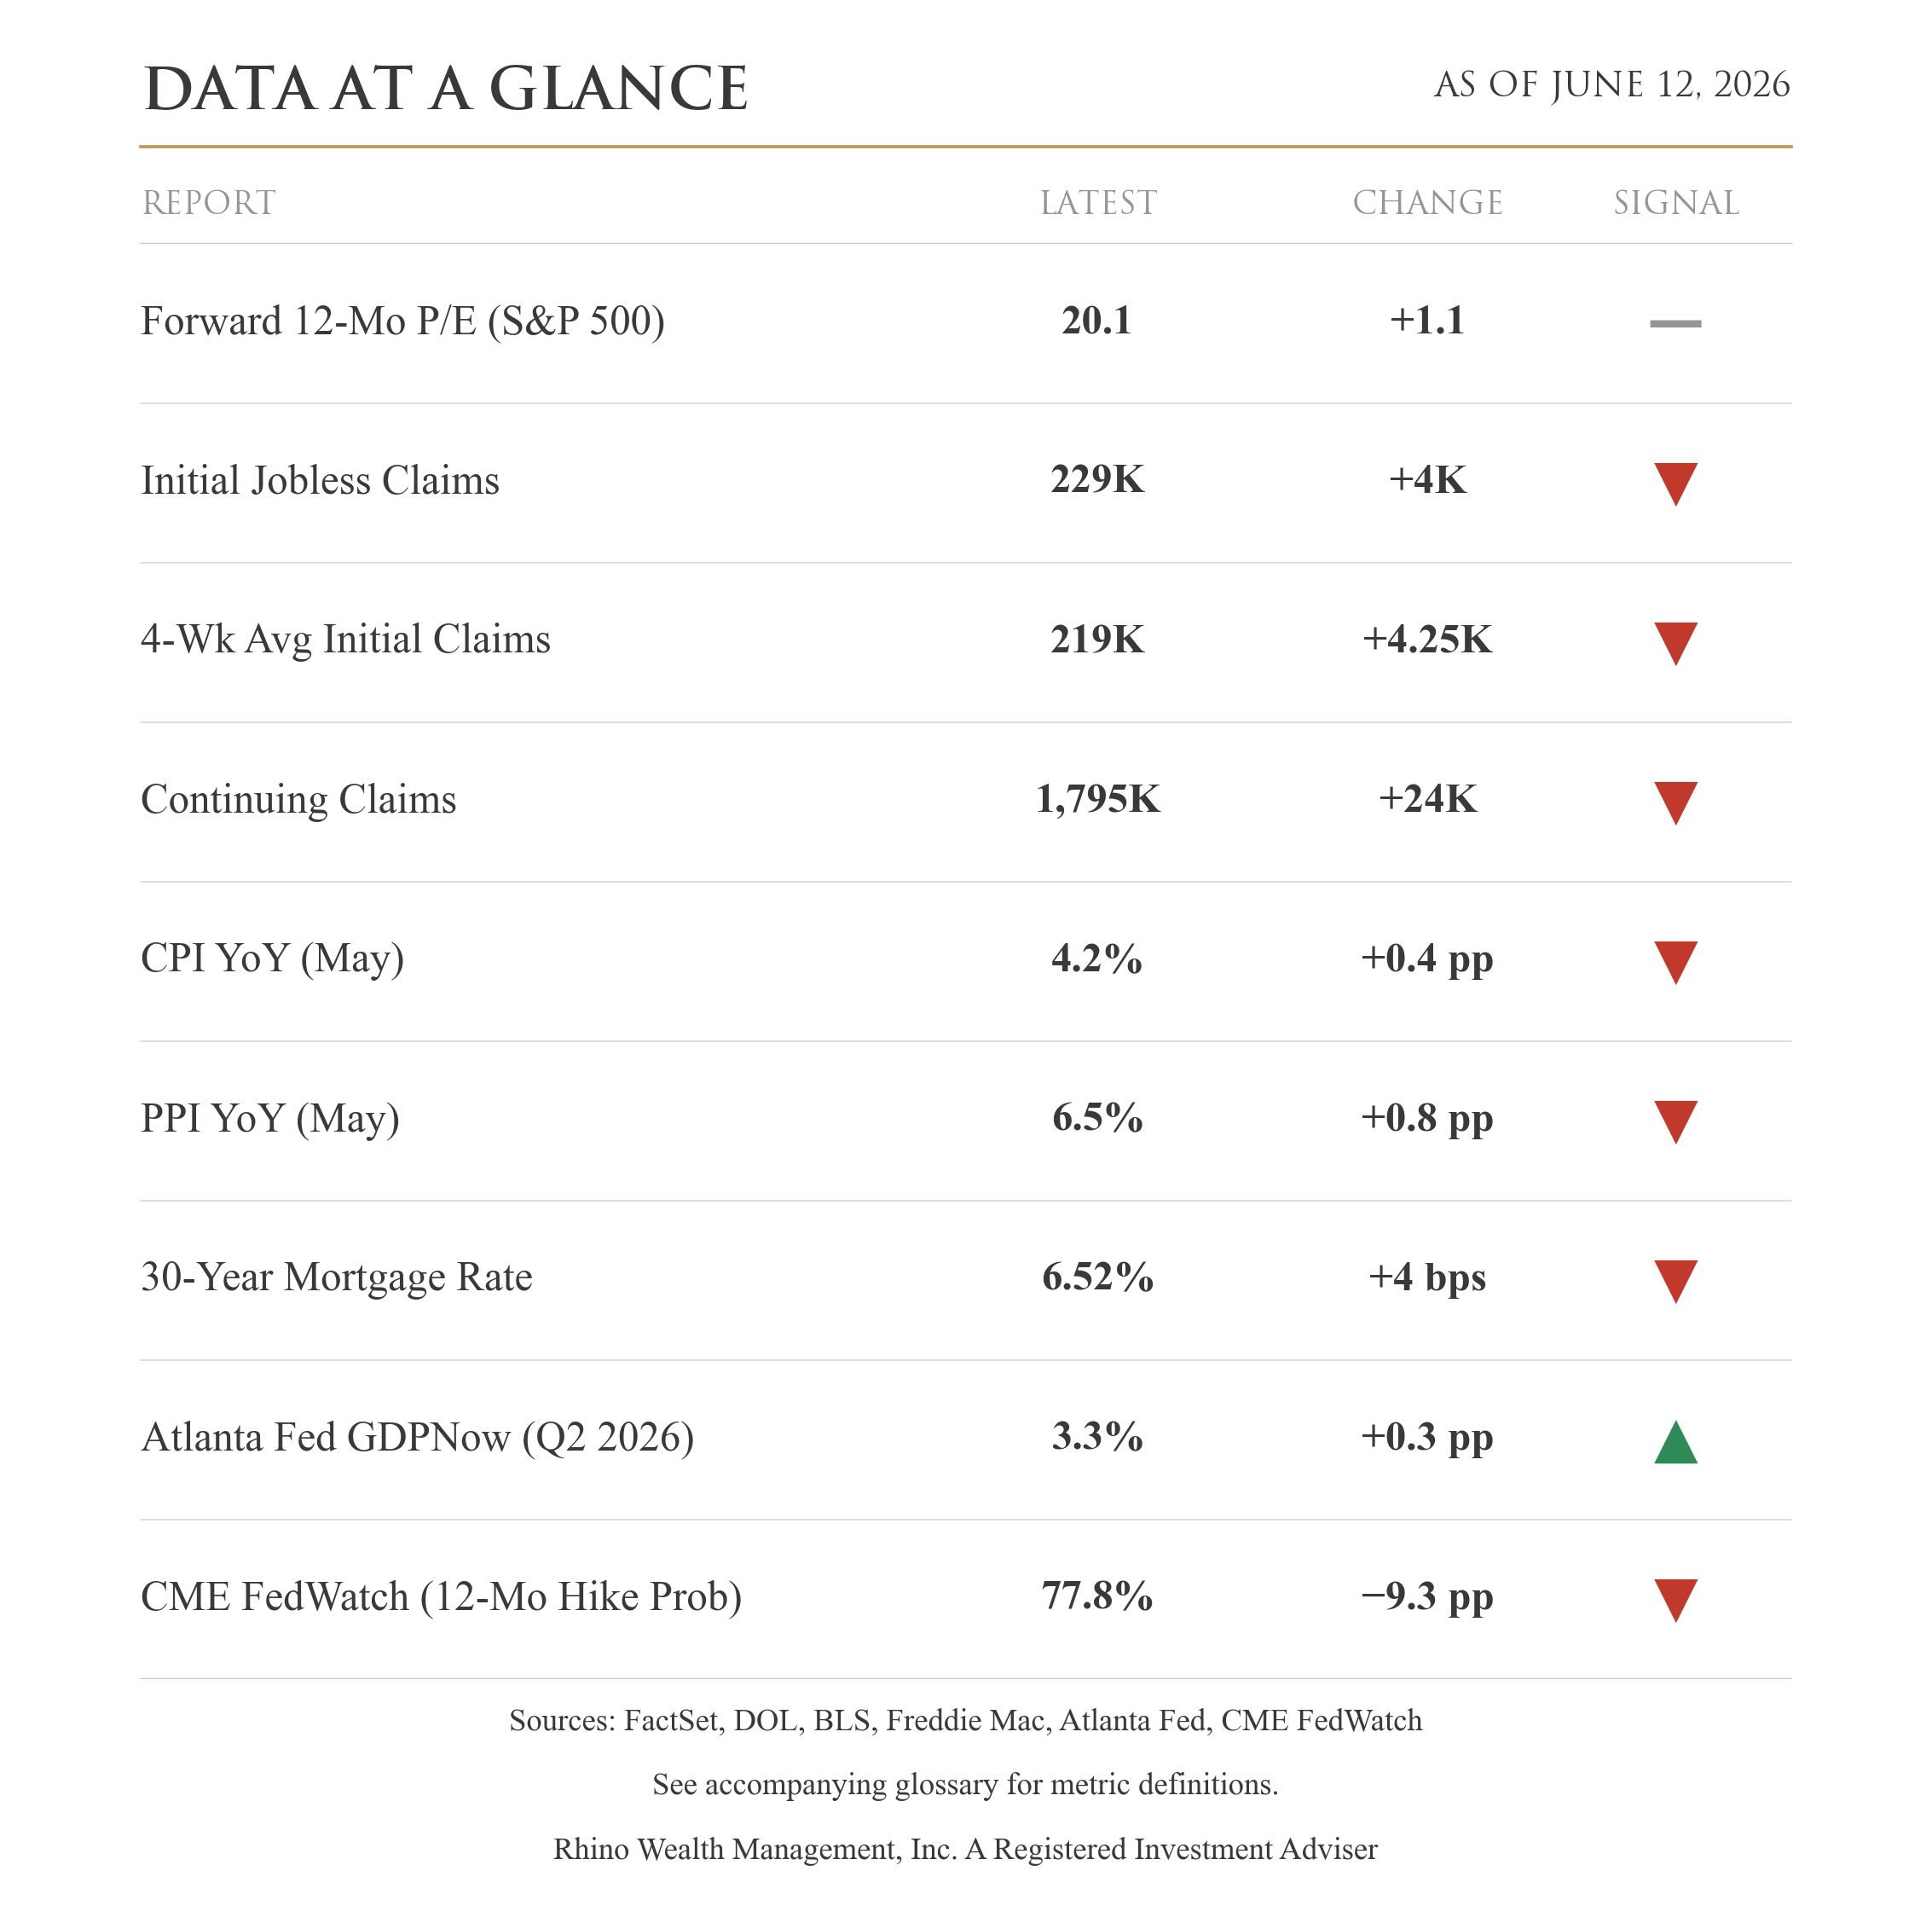
This week's Data at a Glance has more red arrows than usual, so I want to walk through what the numbers say and how they fit together.
Let's start with the Consumer Price Index (CPI) and the Producer Price Index (PPI), the two inflation rows, because they're the heart of the story. Consumer prices rose 4.2% over the past year, up from a 3.8% pace the month before, the first reading above 4% in three years. That's the inflation you and I see at the register. The row beneath it matters even more: wholesale prices, what businesses pay for goods before they reach the shelf, rose 6.5%, up from 5.7%, the fastest pace since late 2022. Wholesale gasoline alone jumped 23% in May. Here's why the gap between those two numbers matters. Businesses don't absorb higher costs forever; they pass them on, usually within a few months. When wholesale inflation runs 6.5% while consumer inflation runs 4.2%, there's more inflation in the pipeline that hasn't reached us yet. And when businesses don't pass on their full costs, the difference comes out of their earnings. Over time, stock prices follow company earnings. If costs rise and earnings fall, stock prices may come under pressure.
That pipeline is what has the Federal Reserve stuck. With prices accelerating, cutting rates is off the table, and the live question is whether they raise them. Europe isn't waiting to find out. The European Central Bank (ECB) raised interest rates this week for the first time in three years, a quarter-point move it tied directly to the energy costs flowing from the war. The futures market, where investors bet real money on the Fed's next move, puts the odds of a rate hike here over the next year at roughly 78%. A year ago, the conversation was about cuts. And notice what higher rates already look like in daily life: the average 30-year mortgage ticked up to 6.52% this week.
There's a detail in that 78% worth pausing on. It was 87% a week ago. The odds fell during a week when both inflation reports got worse, which seems backwards until you remember Thursday's ceasefire news. Nearly all of this inflation surge is energy, and the energy problem is the war. Iran has kept the Strait of Hormuz, the channel carrying roughly 20% of the world's oil, largely blocked since late February. The ceasefire framework would reopen it. Investors are betting that if oil flows again, gas prices fall and inflation cools on its own, no rate hike required. The market moved more on a diplomatic headline than on the inflation data itself. That tells you where the real lever is.
Now the three jobs rows. New claims for unemployment benefits rose to 229,000 this week. The four-week average, which smooths out weekly noise, rose to 219,000. Continuing claims, people still collecting benefits because they haven't found new work, rose by 24,000 to about 1.8 million. One of these rising is a blip. All three rising in the same week, with new claims up from 200,000 since early May, is a job market loosening at the edges. The levels are still healthy. The direction has changed. This is worth watching because a cooling job market is the slow way inflation gets fixed: fewer paychecks, less spending, less pressure on prices. You'd rather see the ceasefire do that job.
The one green arrow is the Atlanta Fed's running estimate of economic growth, now at 3.3% for the current quarter (April through June). Don't read it as just good news; read it as the cushion under everything else. Inflation is forcing the Fed to keep rates high and consider going higher. An economy growing at 3.3% can take that medicine without buckling. If growth were 1%, the same medicine could cause the very downturn it's meant to prevent.
That leaves the first row in the table, saved for last because it's the reason all of this matters to your portfolio: stock valuations. Investors are currently paying about $20.10 for each dollar of earnings companies are expected to produce next year, versus an average of $19 over the past decade. Slightly expensive, not extreme, and down from 21.1 a week ago. Since the market rose this week, the lower multiple means earnings expectations climbed faster than prices did, and that's the better way for that number to come down. But a market at that price has the ceasefire holding and the Fed staying put already baked in. The data says the economy can handle this. The price says investors agree. The risk is in the headlines that could change both.
Also worth noting this week:
Friday brought the market debut of SpaceX, the largest IPO in history, and with it a milestone: Elon Musk became the world's first trillionaire, at least on paper.
Also on Friday, the IAEA, the UN's nuclear watchdog, found Iran non-compliant with its nuclear obligations for the first time in 20 years. Markets shrugged, but it's a reminder of how much work stands between a ceasefire framework and a durable deal. I'm hopeful, not convinced.
Employers added 172,000 jobs in May, roughly double what economists expected. The economy is still hiring even as the claims numbers drift higher at the edges.
The Fed meets Tuesday and Wednesday. No rate change is expected, but we'll get the committee's updated projections for where rates go from here, and next week's note will cover what they say.
I made several adjustments to the portfolio models this week. The models are fully invested and globally diversified, so no single market or story is carrying the load. There's a difference between reacting to headlines and following a process, and a week that swings a percent and a half in each direction on a single headline is exactly when that difference matters. These adjustments came from the process. What I'm watching from here: whether the ceasefire holds and what the Fed signals next week.
Glossary of Terms
Forward 12-Mo P/E (S&P 500) — The price of the S&P 500 index divided by expected company earnings over the next twelve months. It gauges whether stocks are expensive or cheap relative to expected profits; the change shown compares today's multiple to its 10-year average. Source: FactSet.
Initial Jobless Claims — The number of people filing for unemployment benefits for the first time last week. A quick read on layoffs: rising claims suggest a softening job market. Source: U.S. Department of Labor.
4-Wk Avg Initial Claims — The four-week average of initial claims, which smooths out week-to-week noise to show the underlying layoff trend. Source: U.S. Department of Labor.
Continuing Claims — The number of people still collecting unemployment benefits. When it rises, it suggests those who lose jobs are taking longer to find new ones. Source: U.S. Department of Labor.
CPI YoY (May) — The Consumer Price Index measures how much prices for everyday goods and services rose over the past year — the most widely followed gauge of inflation. Source: Bureau of Labor Statistics.
PPI YoY (May) — The Producer Price Index tracks the prices businesses receive for their goods and services. It often signals where consumer prices are headed, since rising costs tend to get passed along. Source: Bureau of Labor Statistics.
30-Year Mortgage Rate — The average rate on a 30-year fixed mortgage, the most common U.S. home loan. Higher rates make homes less affordable. Source: Freddie Mac.
Atlanta Fed GDPNow (Q2 2026) — A running estimate of how fast the U.S. economy is growing this quarter, updated as new data arrives. Not an official figure, but a useful real-time gauge. Source: Federal Reserve Bank of Atlanta.
CME FedWatch (12-Mo Hike Prob) — The probability, implied by futures markets, that the Federal Reserve raises interest rates within the next twelve months. Source: CME FedWatch Tool.
Disclosure:
This material is provided by Todd Van Der Meid, MBA, CFP®, through Rhino Wealth Management, Inc., a Registered Investment Adviser, solely for informational purposes. It is not intended as investment, tax, legal, or accounting advice. Investors should consult qualified professionals before making financial decisions.
Opinions expressed herein are general in nature and not tailored to individual circumstances. Investment strategies discussed may not be suitable for every investor. All investments carry risk, including possible loss of principal, and past performance does not guarantee future results. No investment strategy or risk management technique ensures profit or eliminates risk in all market conditions.
Investments in foreign or emerging markets involve additional risk, such as currency fluctuations, geopolitical instability, and varying accounting standards. Sector-specific investments can be more volatile due to their concentrated nature. References to indexes are for illustrative purposes; indexes are unmanaged, cannot be invested into directly, and their performance does not reflect fees, expenses, or sales charges. Index performance is not indicative of specific investment performance.
Economic forecasts and forward-looking statements reflect current views and assumptions and are subject to change. Actual results may vary materially due to market or other conditions. There is no obligation to update forward-looking information.
Information presented herein comes from reliable third-party sources but is not guaranteed for accuracy or completeness. Rhino Wealth Management, Inc. disclaims liability for errors or omissions. Portions of this content may be generated using advanced analytical tools, including artificial intelligence, and all such content has been reviewed and validated by Todd Van Der Meid, MBA, CFP®, using proprietary quality-control measures. Rhino Wealth Management, Inc. does not directly hold securities; however, securities mentioned may be included within recommended portfolio models or held by clients. Please refer to our Form ADV for additional details regarding potential conflicts of interest.