

A Peace Deal and a Hawkish Fed, in the Same Week
The S&P 500 closed out a volatile week up 0.9%, driven by a signed U.S.-Iran peace deal and a Federal Reserve that came out more hawkish than many expected.
On Wednesday night, the United States and Iran signed an interim agreement that should reopen the Strait of Hormuz and bring oil back online. At least that's the plan. If oil resumes flowing, inflation pressures could ease. A few hours earlier, the Fed signaled it isn't counting on it: Kevin Warsh, running his first meeting as the new Fed chair, made clear the central bank is in no hurry to cut rates, and the committee's projections now show half its members penciling in at least one rate hike this year.
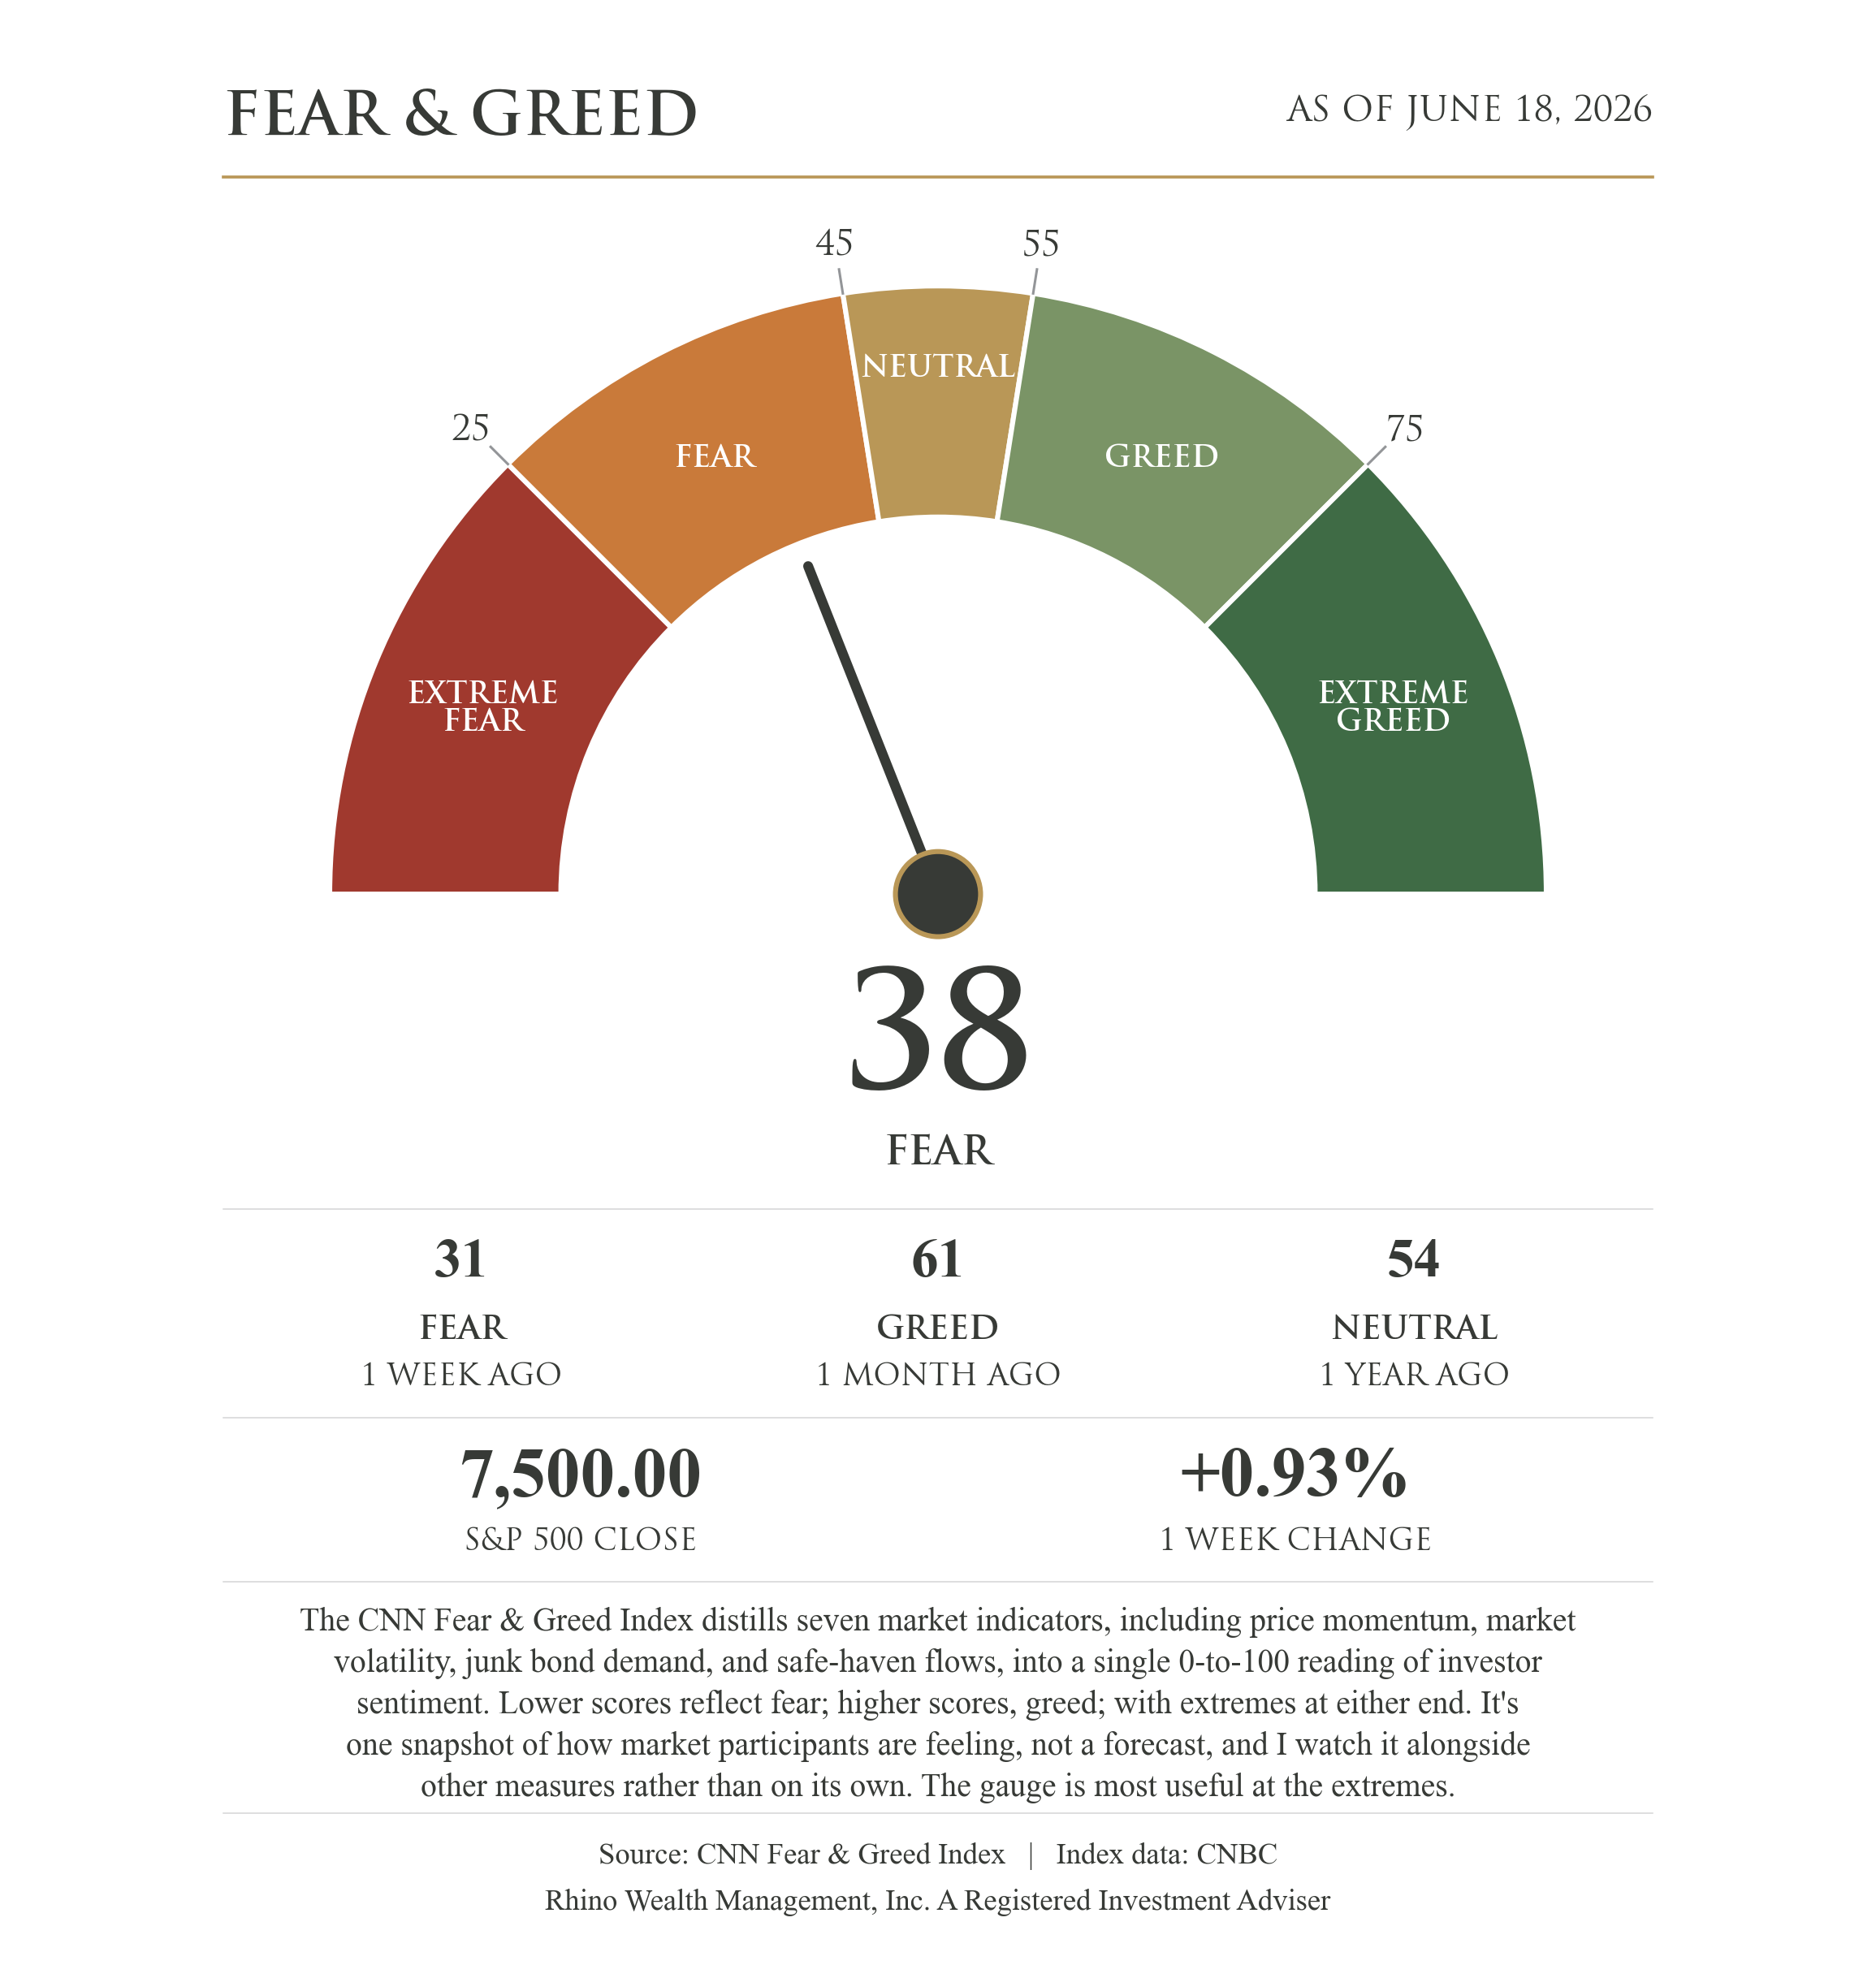
The market closed higher, but investor sentiment didn't. The Fear & Greed Index sits at 38, solidly in Fear, down from Greed a month ago. Investors are nervous about something the price isn't showing yet.
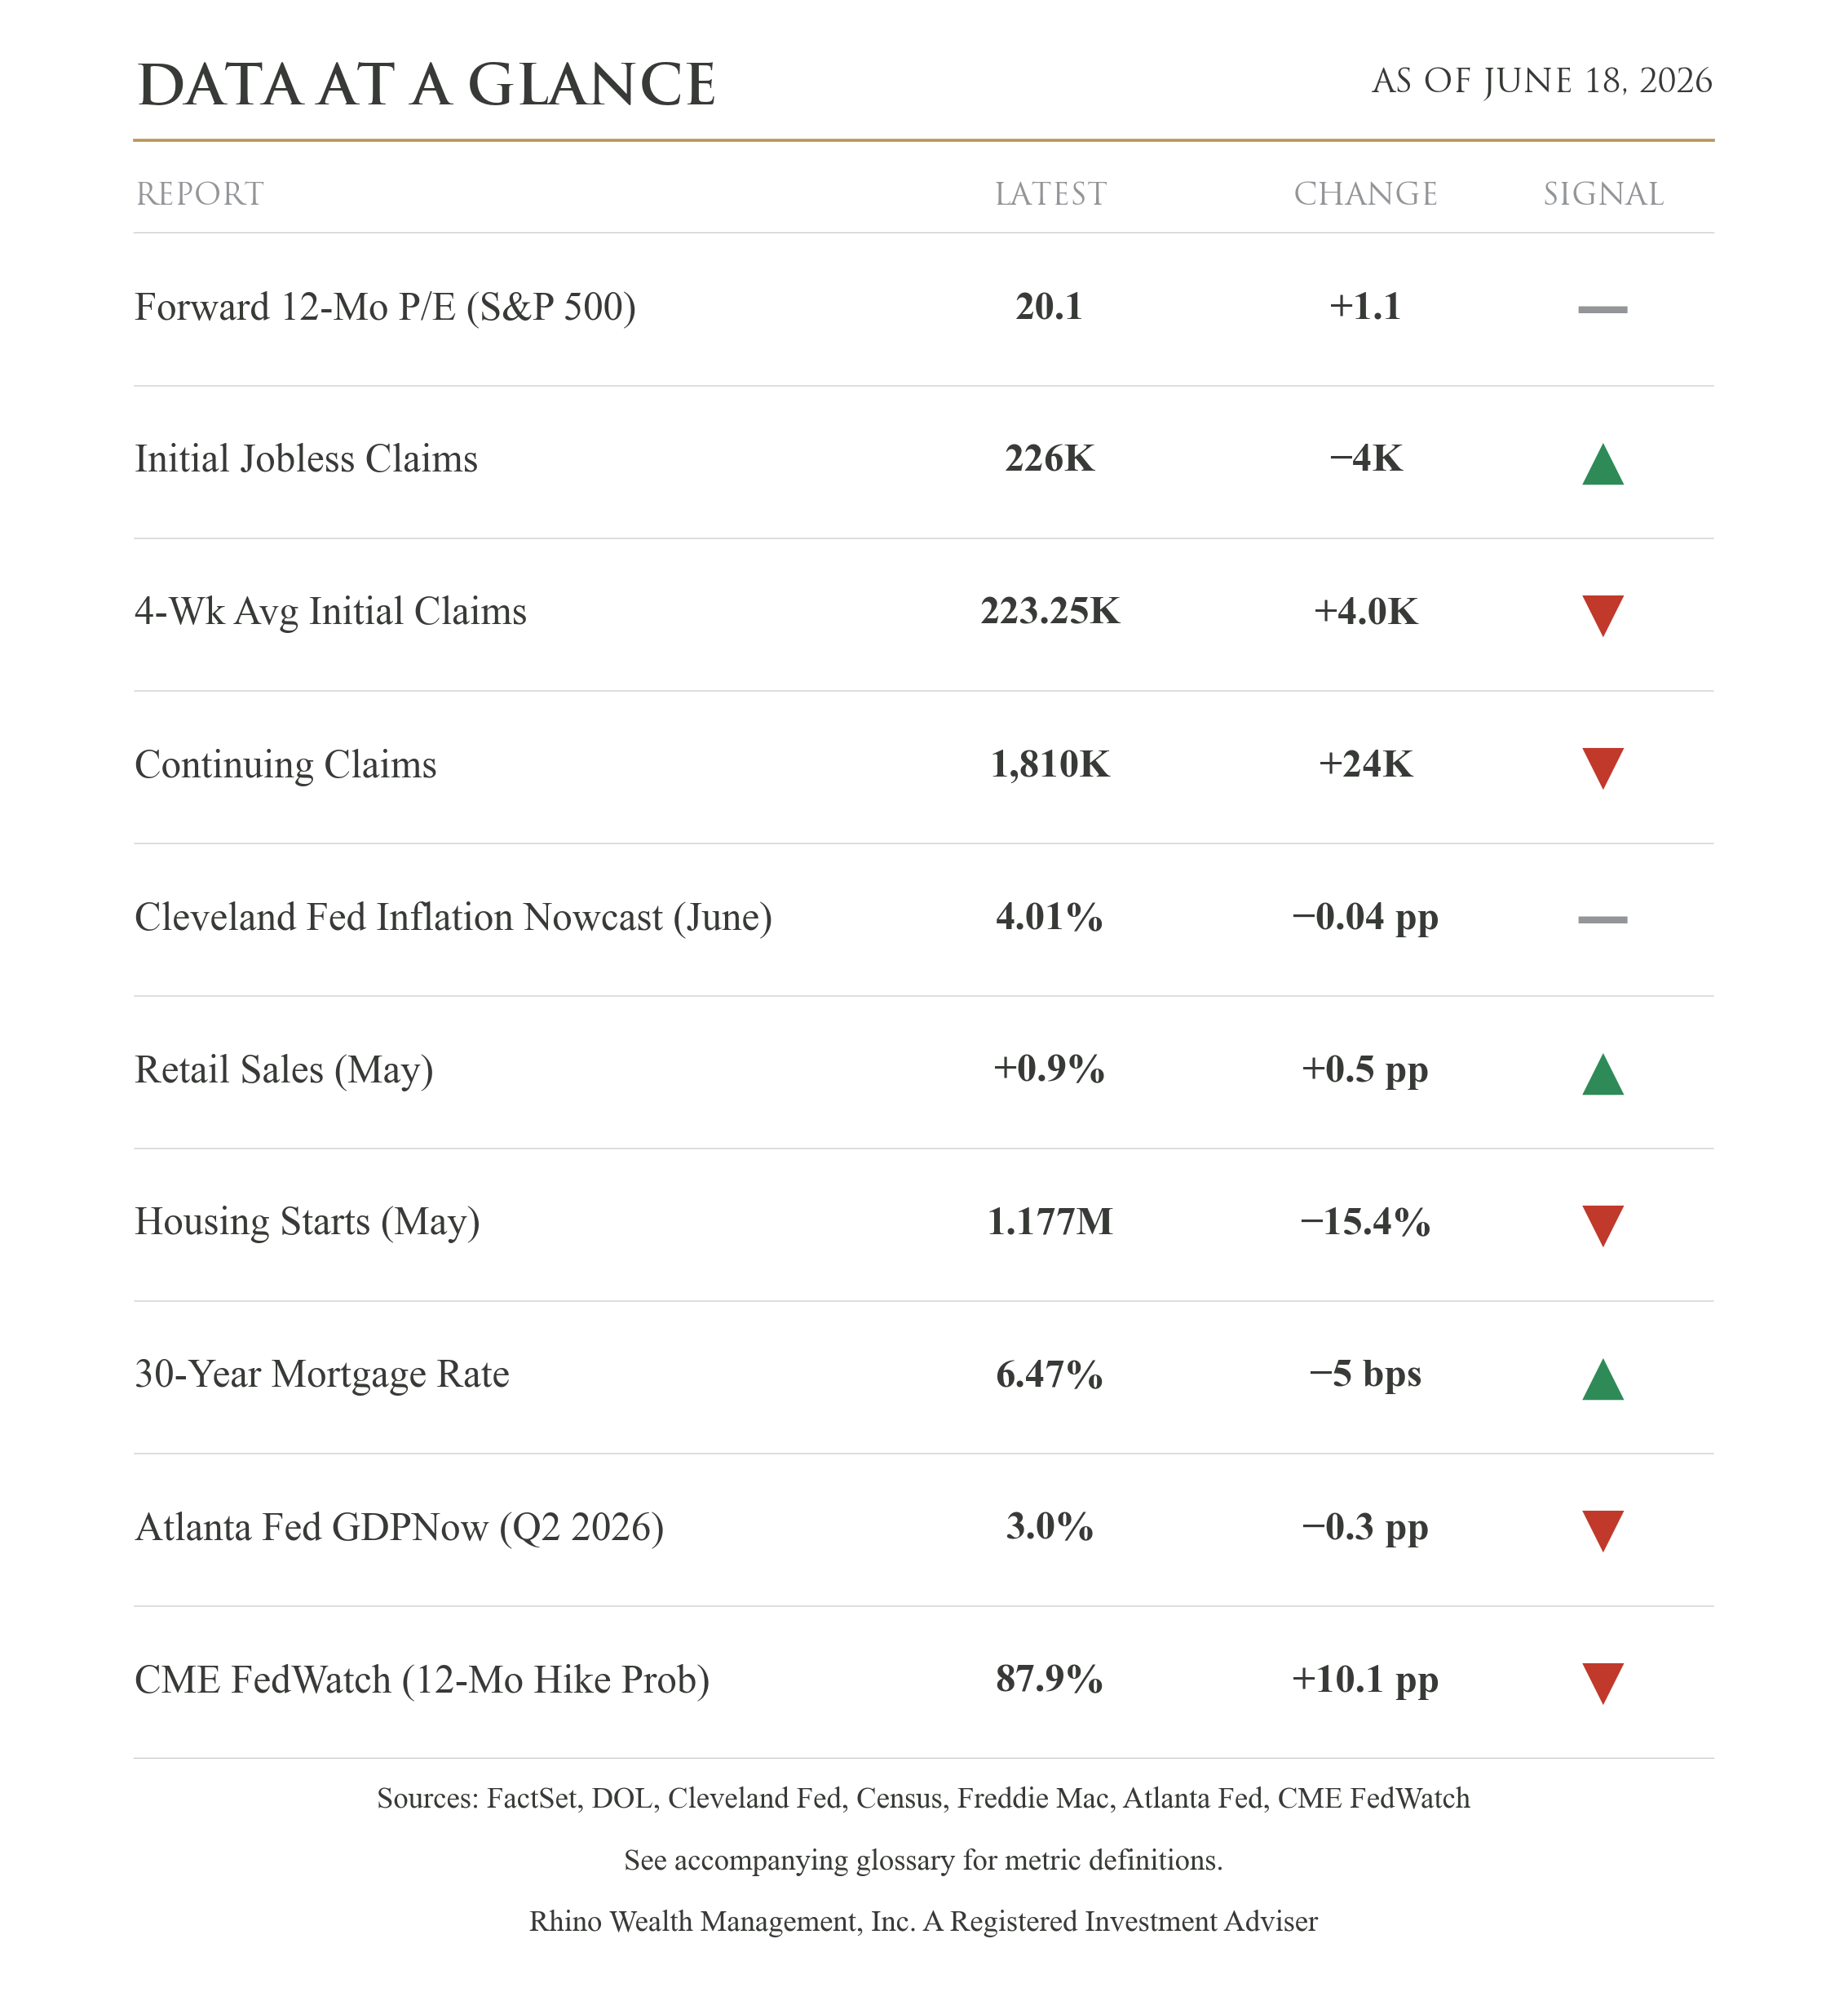
The Fed held rates at 3.5% to 3.75%, as expected. The surprise was the posture. In March, the median official saw rates ending the year at 3.4%, with cuts coming; now that figure is 3.8%, and futures put the odds of a hike over the next year near 88%. The Fed also raised its 2026 inflation forecast to 3.6% from 2.7%. They expect prices to stay hot, and they're done betting inflation is transitory this time.
The deal, meanwhile, targets what is driving our inflation problem. The Strait of Hormuz carries roughly a fifth of the world's oil and has been largely blocked since late February. Oil has already responded, with Brent crude down about 38% from its April high. Nearly all this year's inflation surge was energy, and the energy problem was the war. The cure may have just been signed, but the Fed may not wait to find out if it works.
Signing a deal isn't the same as moving oil; clearing the tanker backlog could take weeks or months. Both sides have sixty days to reach a final deal, and last week's finding that Iran was non-compliant on its nuclear obligations is a reminder of how much can still go wrong. I'm hopeful, but not convinced.
Other data is mixed in a way that explains why the Fed feels free to stay tough. The broad economy is holding up, retail sales rose 0.9% in May, and growth is tracking near 3% for the quarter. Where the strain is starting to show is in housing. The area most sensitive to interest rates is housing starts which fell 15.4% in May with the 30-year mortgage at 6.47%. Housing is where the pinch shows up first. The rest of the economy is strong enough to absorb it, and that strength is exactly what lets the Fed keep pressing on inflation rather than let up. In past cycles the Fed has pressed until something broke. Let's hope this time is different.
So the good news and the cautionary news arrived in the same week. The path to lower inflation got clearer; the Fed's willingness to bet on it got smaller. For your portfolio, the message hasn't changed: the models stay fully invested and globally diversified, so no single headline carries the load. A week that swings this hard on the day's news is exactly when process beats reaction.
Glossary of Terms
Forward 12-Mo P/E (S&P 500) — How expensive large U.S. company stocks are relative to the profits analysts expect over the next year. A higher number means investors are paying more for each dollar of anticipated earnings. Source: FactSet.
Initial Jobless Claims — The number of people who filed for unemployment benefits for the first time last week. It's one of the most timely signals of how many workers are newly losing their jobs. Source: U.S. Department of Labor.
4-Wk Avg Initial Claims — The four-week average of those first-time filings. Averaging smooths out week-to-week noise to show the underlying trend in layoffs. Source: U.S. Department of Labor.
Continuing Claims — The number of people still collecting unemployment benefits after their initial claim. A rising figure suggests it's taking longer for the unemployed to find new work. Source: U.S. Department of Labor.
Cleveland Fed Inflation Nowcast (June) — A running estimate of the current month's inflation rate, built from incoming price data before the official inflation report is released. Source: Federal Reserve Bank of Cleveland.
Retail Sales (May) — The month-over-month change in total spending at U.S. stores and restaurants. A broad read on how willing consumers are to spend. Source: U.S. Census Bureau.
Housing Starts (May) — The number of new homes builders began constructing, stated as an annual rate. It reflects builder confidence and momentum in the housing market. Source: U.S. Census Bureau.
30-Year Mortgage Rate — The average interest rate on a 30-year fixed-rate home loan, which directly affects what it costs to buy a home. Source: Freddie Mac.
Atlanta Fed GDPNow (Q2 2026) — A real-time estimate of how fast the economy is growing this quarter, updated as new data arrives ahead of the government's official GDP report. Source: Federal Reserve Bank of Atlanta.
CME FedWatch (12-Mo Hike Prob) — The probability, derived from futures-market pricing, that the Federal Reserve will have raised interest rates at least once over the coming year. A higher number means traders increasingly expect tighter policy ahead. Source: CME Group.
Disclosure:
This material is provided by Todd Van Der Meid, MBA, CFP®, through Rhino Wealth Management, Inc., a Registered Investment Adviser, solely for informational purposes. It is not intended as investment, tax, legal, or accounting advice. Investors should consult qualified professionals before making financial decisions.
Opinions expressed herein are general in nature and not tailored to individual circumstances. Investment strategies discussed may not be suitable for every investor. All investments carry risk, including possible loss of principal, and past performance does not guarantee future results. No investment strategy or risk management technique ensures profit or eliminates risk in all market conditions.
Investments in foreign or emerging markets involve additional risk, such as currency fluctuations, geopolitical instability, and varying accounting standards. Sector-specific investments can be more volatile due to their concentrated nature. References to indexes are for illustrative purposes; indexes are unmanaged, cannot be invested into directly, and their performance does not reflect fees, expenses, or sales charges. Index performance is not indicative of specific investment performance.
Economic forecasts and forward-looking statements reflect current views and assumptions and are subject to change. Actual results may vary materially due to market or other conditions. There is no obligation to update forward-looking information.
Information presented herein comes from reliable third-party sources but is not guaranteed for accuracy or completeness. Rhino Wealth Management, Inc. disclaims liability for errors or omissions. Portions of this content may be generated using advanced analytical tools, including artificial intelligence, and all such content has been reviewed and validated by Todd Van Der Meid, MBA, CFP®, using proprietary quality-control measures. Rhino Wealth Management, Inc. does not directly hold securities; however, securities mentioned may be included within recommended portfolio models or held by clients. Please refer to our Form ADV for additional details regarding potential conflicts of interest.