

A Good Family Fight
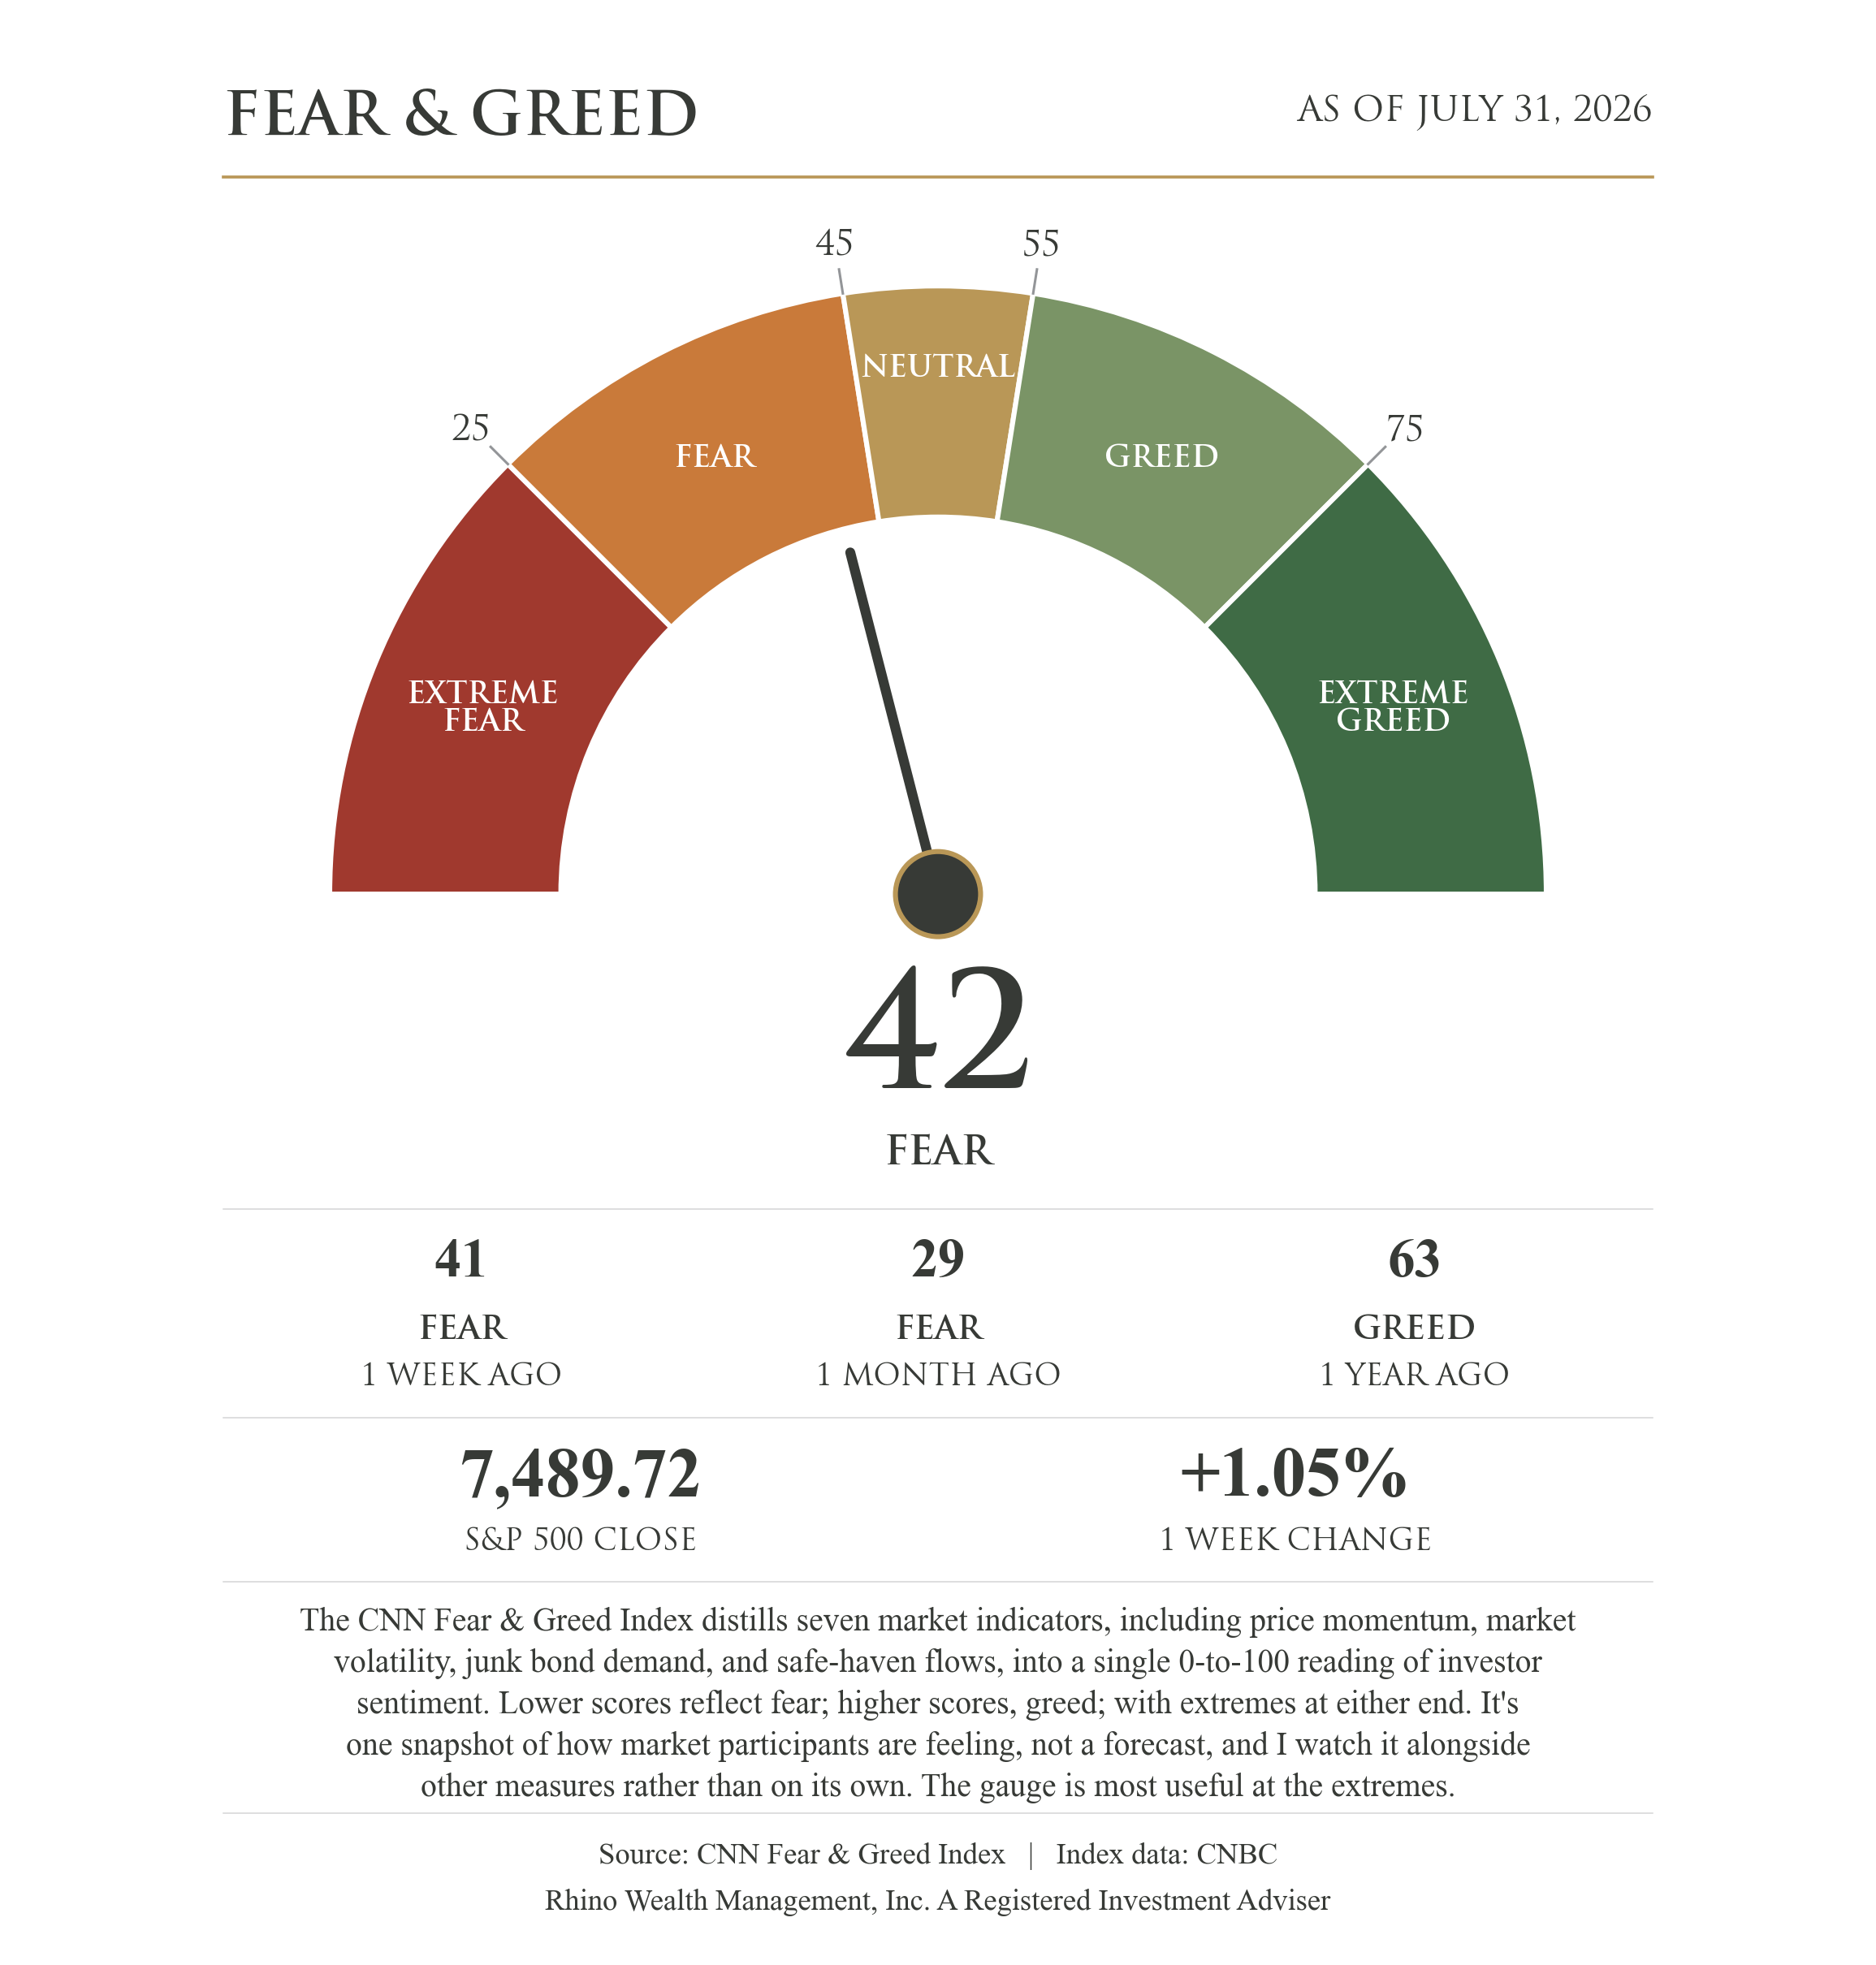
The S&P 500 rose 1.05% this week to close July at 7,489.72, and the Federal Reserve held its benchmark rate at 3.50% to 3.75% for the fifth straight meeting. What made this meeting different was the vote: 9 to 3, with all three dissenters wanting rates higher rather than lower. It's the first time since 2016 that three officials broke ranks in the same direction. Fed Chair Kevin Warsh put it plainly afterward. "I asked for a good family fight, and I got one."
A Divided Fed
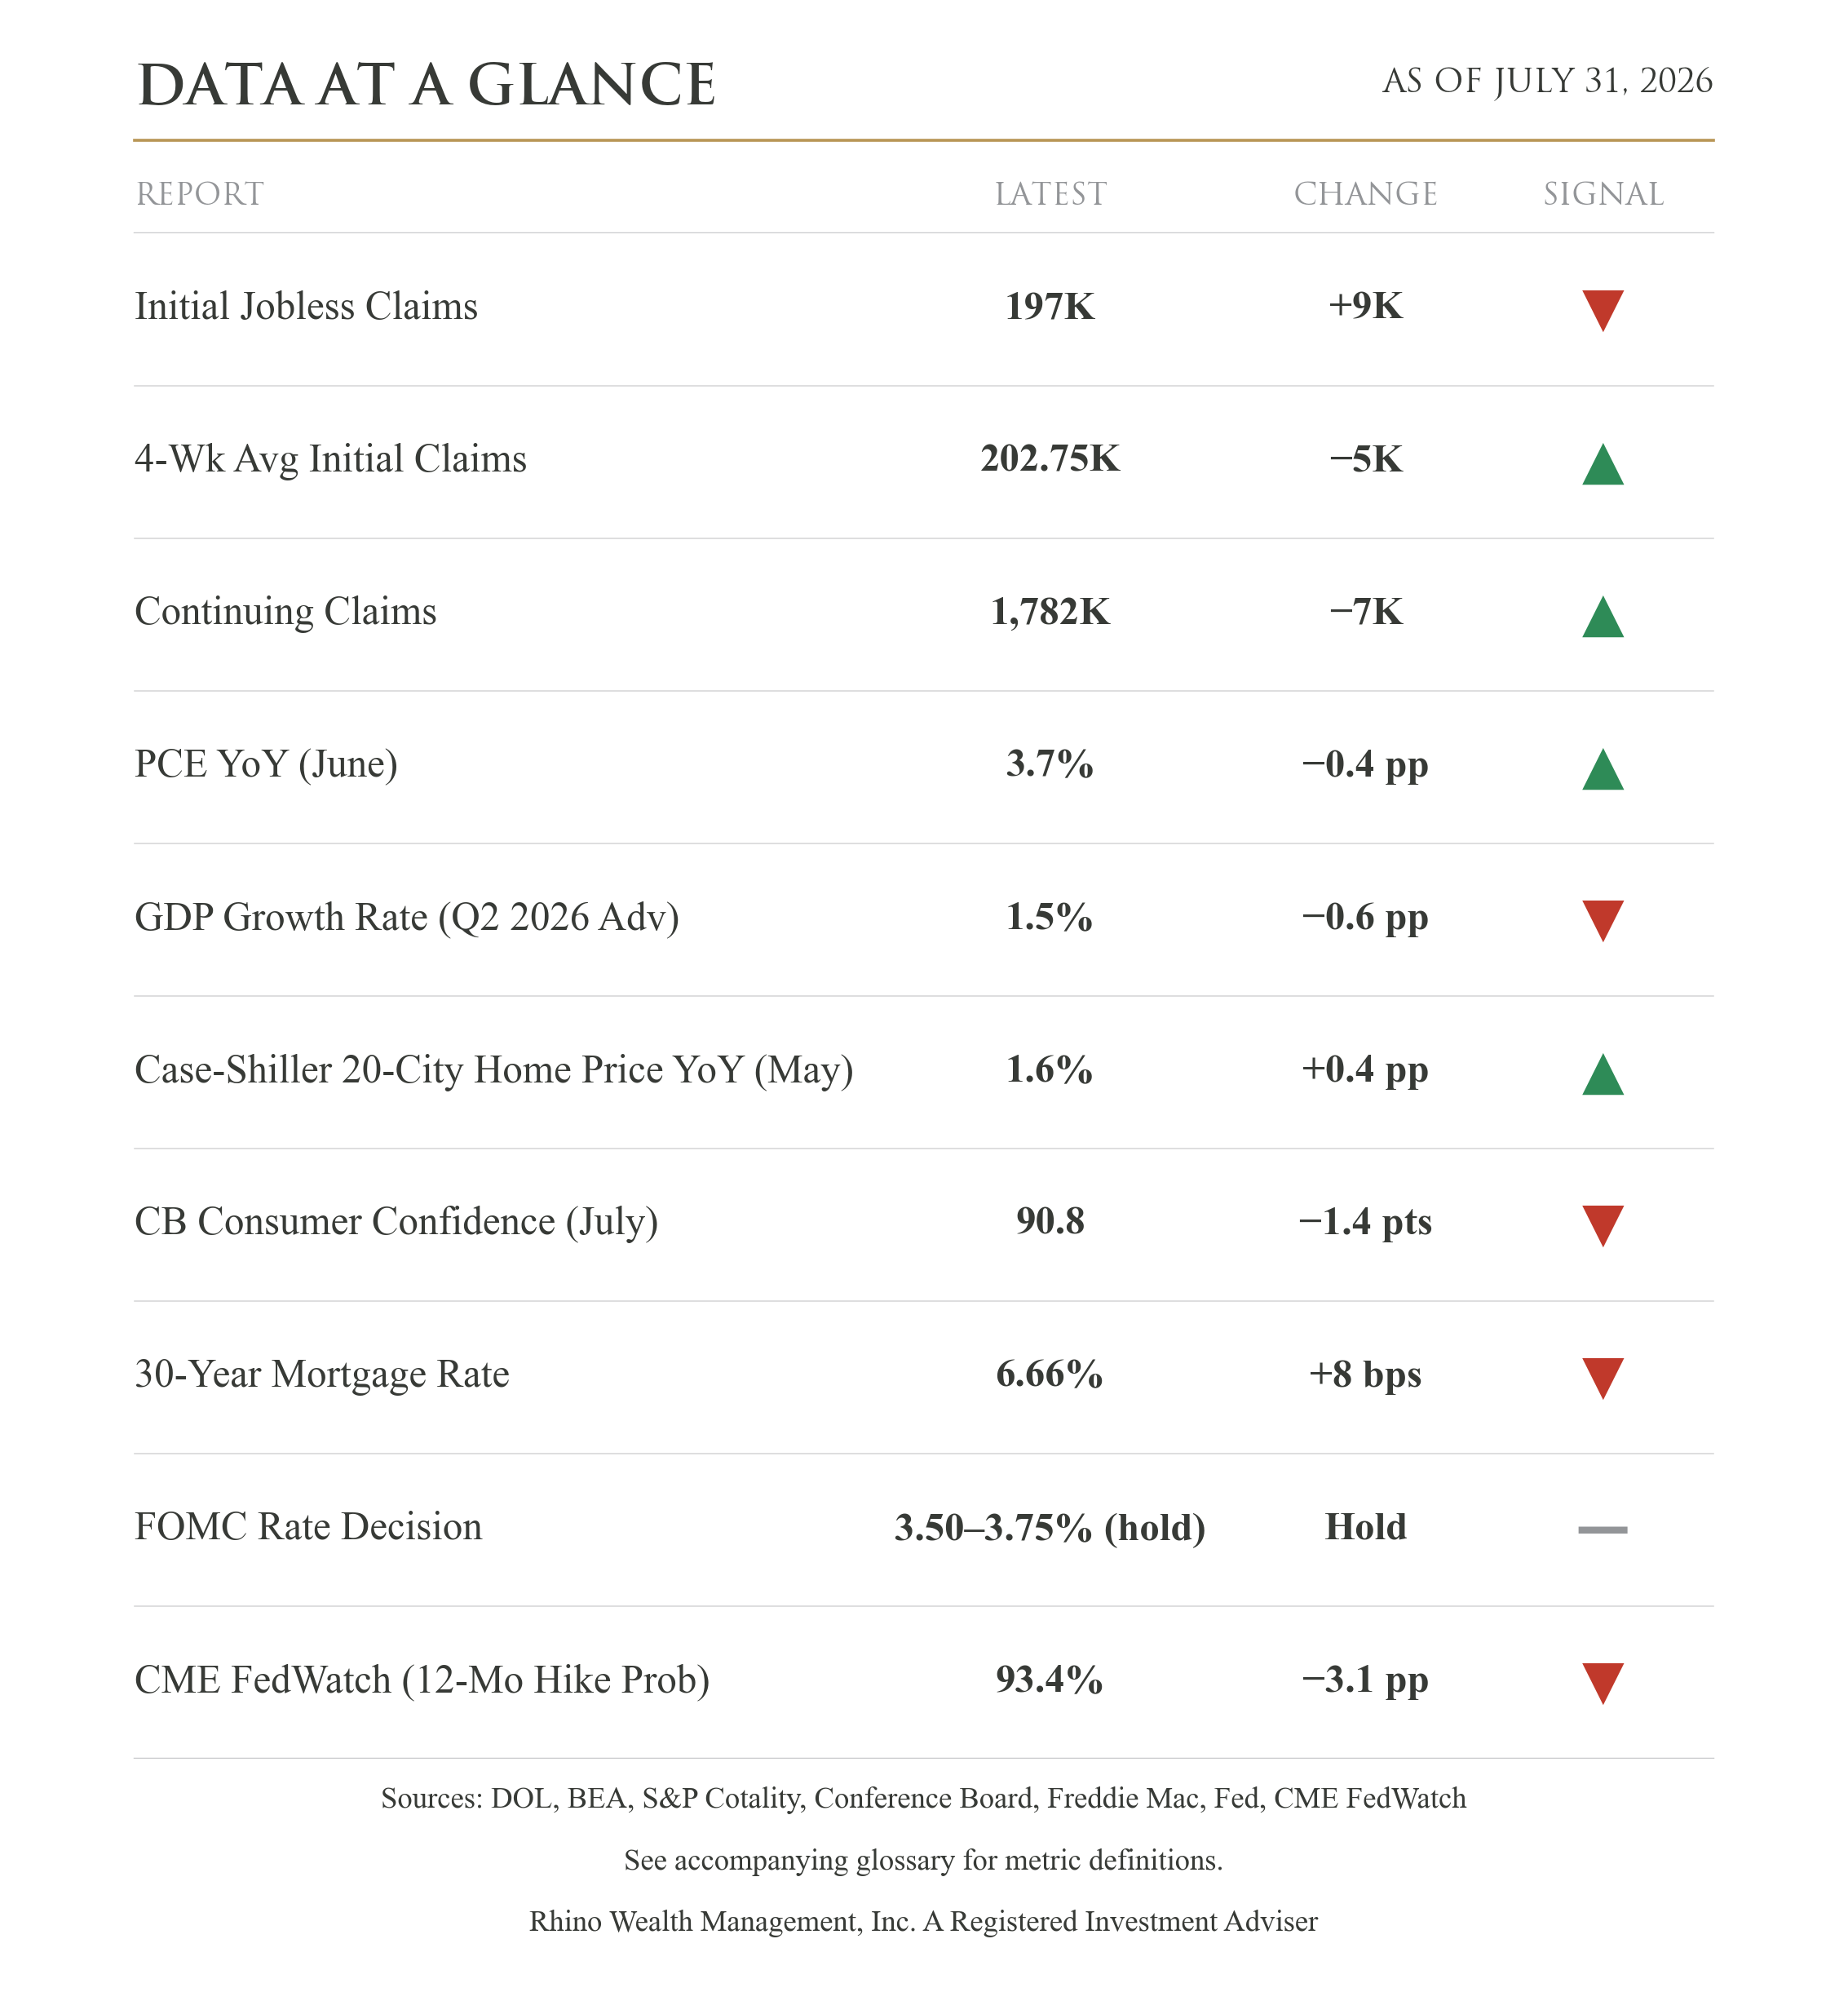
Last week I said to watch Thursday's growth and inflation numbers. Both arrived, and both looked like the case for patience. The Personal Consumption Expenditures (PCE) price index, the inflation gauge the Fed watches most closely, cooled to 3.7% in June from 4.1% in May. Second-quarter GDP, the broadest measure of economic output, slowed to 1.5% from 2.1%. Cooler inflation and slower growth usually take rate hikes off the table. This week the pressure ran the other way.
Cleveland Fed President Beth Hammack, Minneapolis Fed President Neel Kashkari, and Dallas Fed President Lorie Logan each voted to raise rates a quarter point, and all three published statements Friday explaining why. Their shared argument is that inflation has run above the Fed's 2% target for five consecutive years, and consumer prices are up 20.8% over that period. Hammack said that with unemployment near her estimate of full employment, high inflation is the more pressing problem. Kashkari argued that small hikes now beat aggressive ones later. Warsh didn't dissent, but he didn't soften the target either: "There is no soft inflation target, there is no soft implicit target, not on this Committee's watch. There is only a target, and it is 2 percent." The futures market puts the odds of a higher policy rate a year from now at 93.4%, down slightly from last week and still close to a sure thing.
Long Rates
The 30-year Treasury yield closed the week at 5.27%, its highest since 2007. That yield is what investors demand to lend the government money for three decades, so it responds to long-run inflation expectations more than to any single Fed meeting. It rose while the Fed sat still, and Warsh flagged the move himself, noting that yields across the Treasury curve are materially higher than at the June meeting and that the increase ranks among the largest between meetings in the past two decades. He read it as investors responding to the data rather than to the Fed, saying market participants are "learning to play the ball, not the referee." The average 30-year mortgage followed, up 8 basis points to 6.66%.
Housing
The Case-Shiller 20-city home price index rose 1.6% over the year through May while inflation ran at 3.7%. When a price rises more slowly than inflation it's effectively falling, so home prices are still climbing on paper and losing ground in purchasing power.
Oil
West Texas Intermediate crude closed Friday at $86.80, capping a July gain of more than 20% on supply uncertainty out of Iran and Venezuela. Energy feeds gas prices, shipping costs, and eventually the inflation figures the FOMC is arguing about.
Valuations
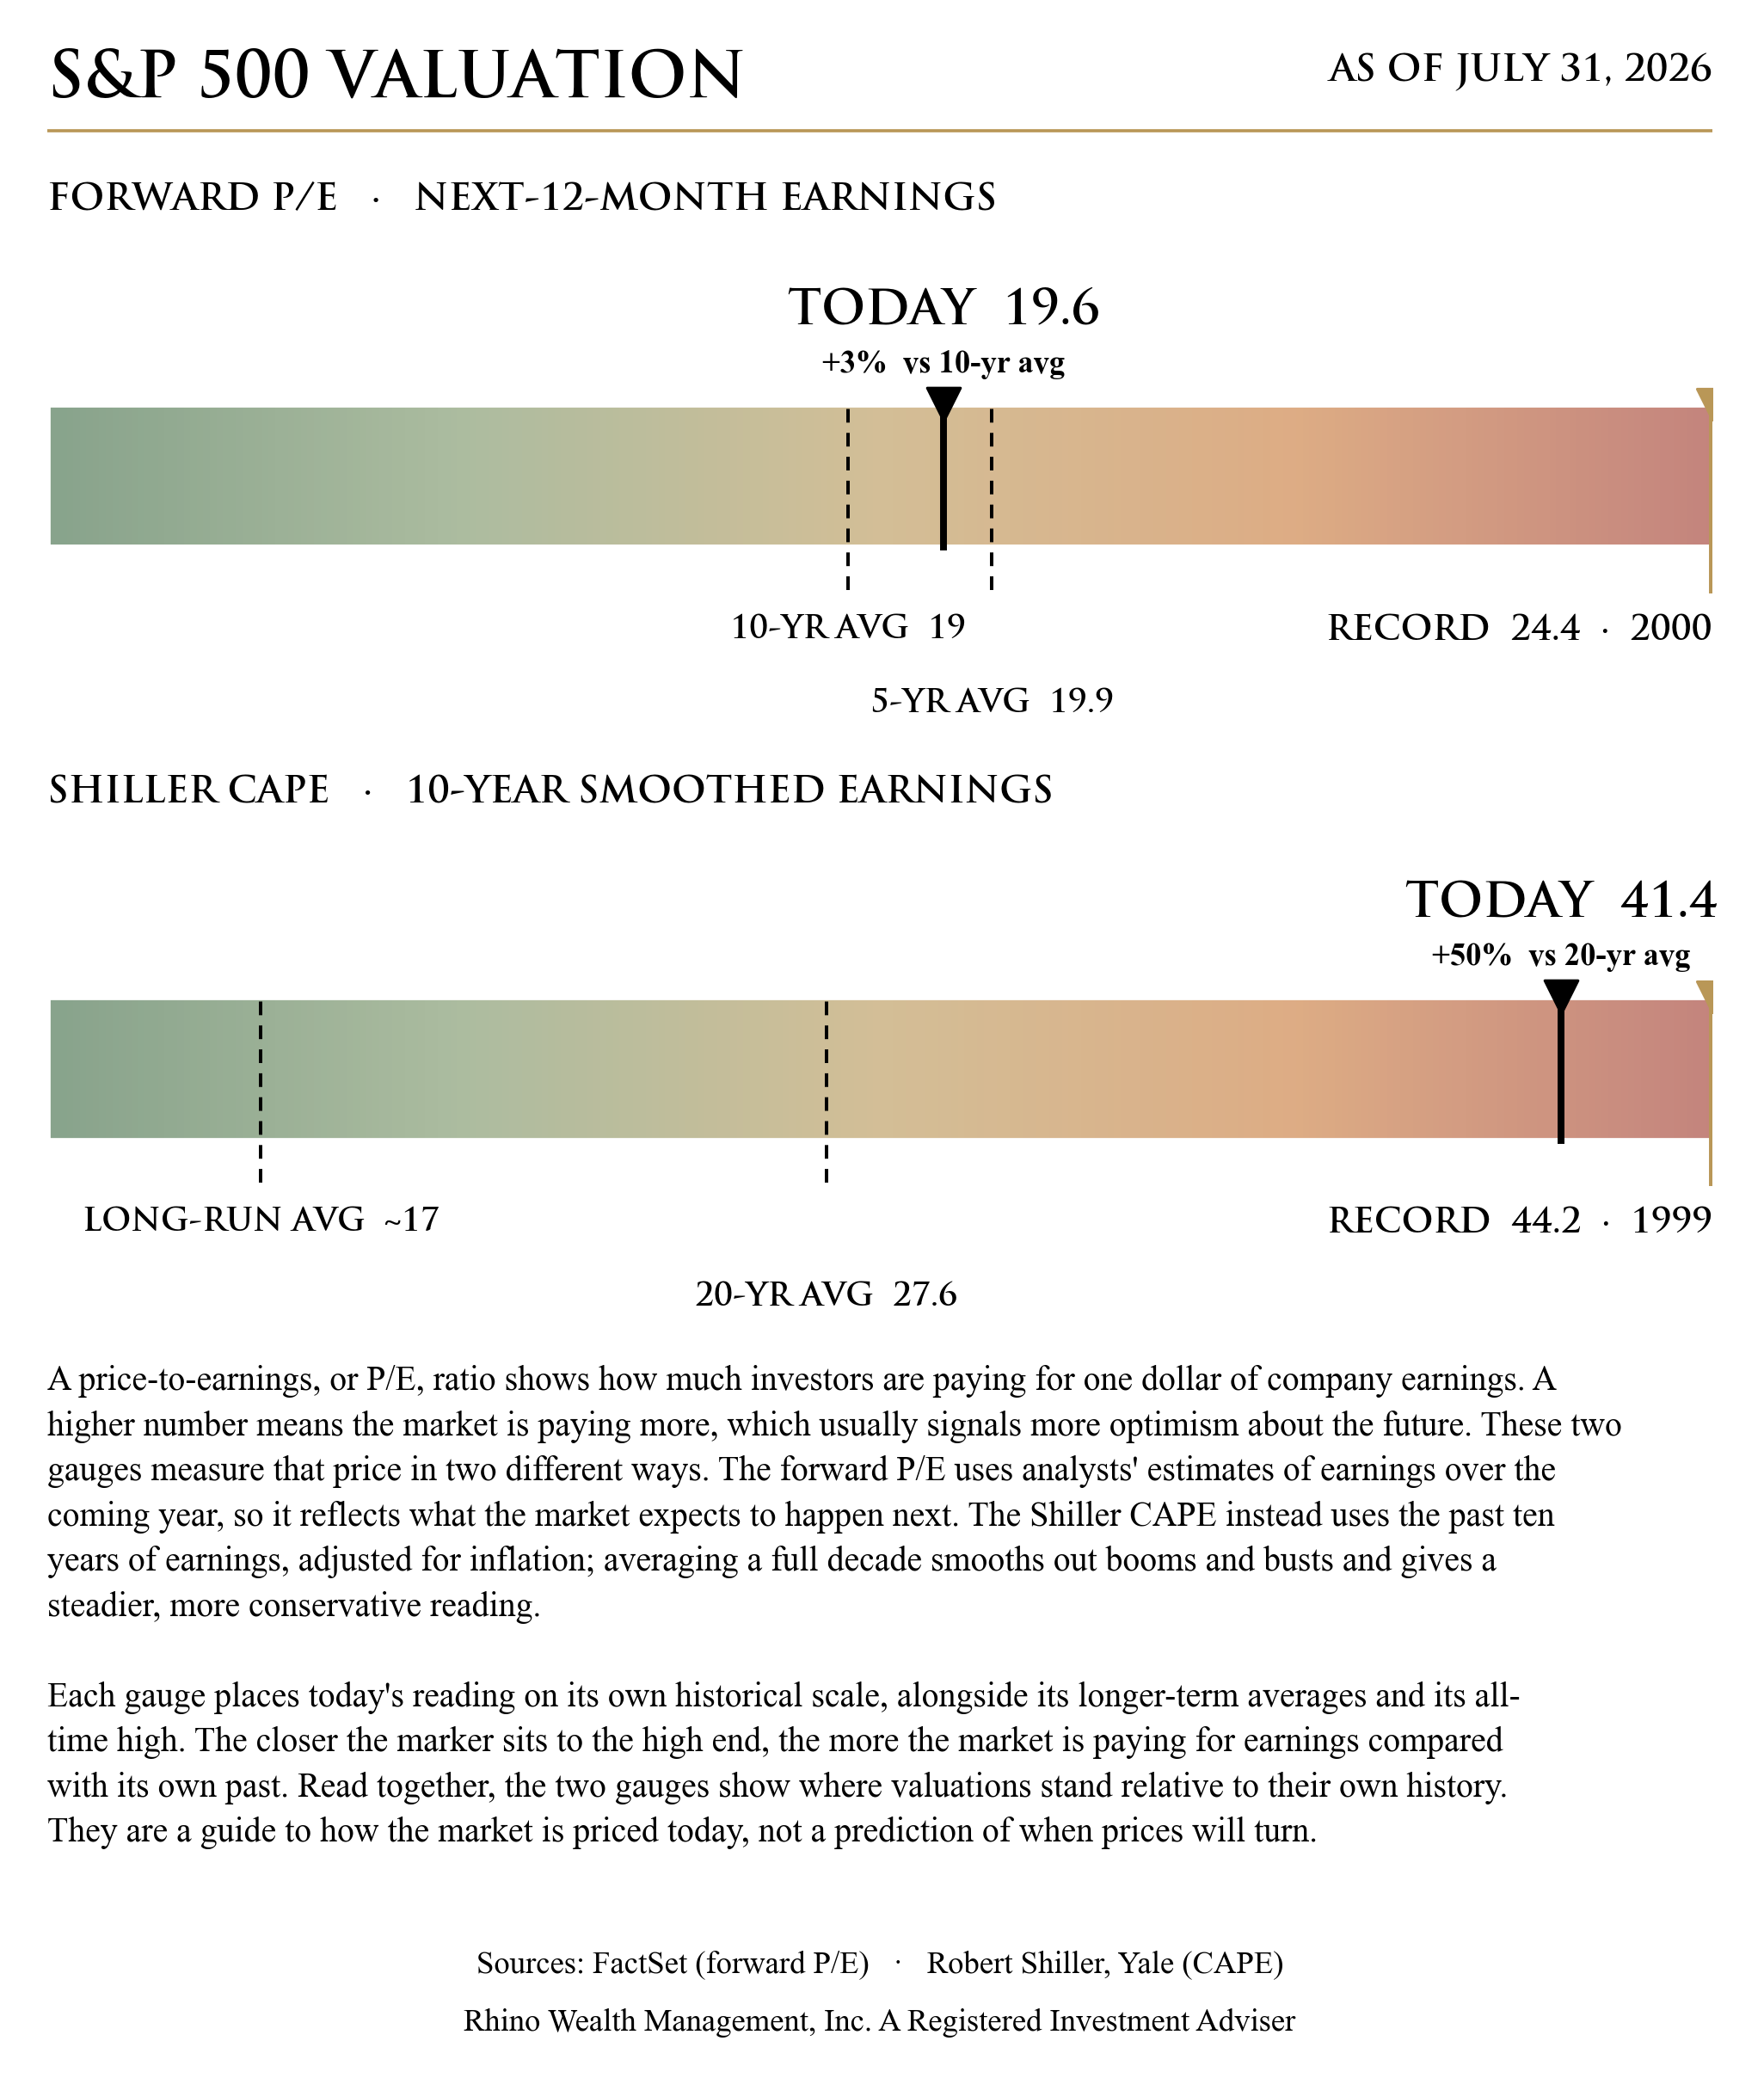
The two valuation gauges disagree right now. Investors are paying 19.6 times next year's expected earnings, only 3% above the ten-year average and close to normal. The Shiller CAPE, which compares price to ten years of inflation-adjusted earnings, sits at 41.4, roughly 50% above its 20-year average and within reach of its 1999 record. Expected earnings make the market look fairly priced. Actual earnings over the past decade make it look expensive.
The Portfolio Models
Each morning I pull a set of economic and market data to check how our portfolio models should be positioned between stocks and bonds. Right now that data supports staying fully invested. Credit markets show no signs of stress, and companies are borrowing at some of the cheapest rates of this cycle relative to government bonds. New claims for unemployment benefits are averaging about 203,000 a week, near their lows, and surveys of both manufacturers and service businesses show activity expanding. The S&P 500 sits about 6% above its 200-day average, a common measure of a healthy trend. I use a data-driven process because emotion makes it easy to reach the wrong conclusion about the economy. With tensions overseas, inflation running hot, a Fed that may raise rates, and midterm elections ahead, getting defensive wouldn't be unreasonable. The data says otherwise. If the data changes, I'll shift the models accordingly.
That same daily data does more than set the overall mix of stocks and bonds. It also scores US sectors, world regions, and bond types, and those scores shape how the models are built. Over the past two weeks the data has been trimming technology and communication companies while adding health care, financials, and materials. Energy still carries the highest score of any US sector, though that score has weakened lately and its lead over the rest is narrowing. Overseas, the data has steadily favored Southeast Asia while reducing Korea and Taiwan, and it recently began improving on Europe. In bonds, it continues to point the models toward short-term corporate bonds rather than long-term bonds, which lost value as long-term rates rose. These shifts happen in small steps, a little each day, which tells me the data is repositioning the models rather than playing defense. None of it comes from headlines or hunches. The models go where the data leads, even when the news might tempt us somewhere else.
What I'm Watching From Here
Whether September becomes a live meeting for a hike. Three dissenters going public in the same week the 30-year yield hit a 19-year high tells you the committee's patience has a shelf life. August brings the jobs report next Friday and the Consumer Price Index (CPI) mid-month, and with energy prices where they are, the inflation reading is the one I'll be watching hardest. As always, I'll do my best to keep you informed.
Glossary of Terms
Initial Jobless Claims — The number of people who filed for unemployment benefits for the first time last week. It's one of the timeliest reads on the job market: fewer claims means fewer layoffs. Source: U.S. Department of Labor.
4-Week Average Initial Claims — The average of initial jobless claims over the past four weeks. Smoothing out the week-to-week noise gives a clearer picture of the underlying layoff trend. Source: U.S. Department of Labor.
Continuing Claims — The number of people still receiving unemployment benefits after their first week. It reflects how easily laid-off workers are finding new jobs; a lower number is better. Source: U.S. Department of Labor.
PCE YoY (June) — The Personal Consumption Expenditures price index, measured against a year earlier. It's the inflation gauge the Federal Reserve watches most closely when judging progress toward its 2% target. Source: U.S. Bureau of Economic Analysis.
GDP Growth Rate (Q2 2026 Advance) — The first official estimate of how fast the economy grew from April through June, stated as an annual rate. Gross domestic product is the broadest measure of economic output. This figure gets revised twice as more data arrive. Source: U.S. Bureau of Economic Analysis.
Case-Shiller 20-City Home Price YoY (May) — The change in home prices across 20 major U.S. metro areas compared with a year earlier. When this number runs below inflation, homes are gaining value in dollars and losing it in purchasing power. Source: S&P CoreLogic Case-Shiller.
CB Consumer Confidence (July) — A survey-based index of how households feel about business conditions, jobs, and their own income prospects. Confidence tends to lead spending, so a falling reading hints at more cautious consumers ahead. Source: The Conference Board.
30-Year Mortgage Rate — The average interest rate on a 30-year fixed-rate home loan this week. It directly affects what buyers pay each month, so higher rates weigh on affordability. Source: Freddie Mac Primary Mortgage Market Survey.
FOMC Rate Decision — The Federal Open Market Committee's target range for the federal funds rate, the overnight rate banks charge each other. It anchors short-term borrowing costs across the economy. Source: Federal Reserve.
CME FedWatch (12-Mo Hike Prob) — The market-implied probability that the Federal Reserve's benchmark interest rate will be higher one year from now than it is today, derived from fed funds futures prices. A rising figure means traders increasingly expect tighter policy ahead. (Technically, it is the probability that the target rate sits above today's range at the FOMC meeting nearest the 12-month mark, not a count of individual rate hikes.) Source: CME FedWatch Tool.
Disclosure:
This material is provided by Todd Van Der Meid, MBA, CFP®, through Rhino Wealth Management, Inc., a Registered Investment Adviser, solely for informational purposes. It is not intended as investment, tax, legal, or accounting advice. Investors should consult qualified professionals before making financial decisions.
Opinions expressed herein are general in nature and not tailored to individual circumstances. Investment strategies discussed may not be suitable for every investor. All investments carry risk, including possible loss of principal, and past performance does not guarantee future results. No investment strategy or risk management technique ensures profit or eliminates risk in all market conditions.
Investments in foreign or emerging markets involve additional risk, such as currency fluctuations, geopolitical instability, and varying accounting standards. Sector-specific investments can be more volatile due to their concentrated nature. References to indexes are for illustrative purposes; indexes are unmanaged, cannot be invested into directly, and their performance does not reflect fees, expenses, or sales charges. Index performance is not indicative of specific investment performance.
Economic forecasts and forward-looking statements reflect current views and assumptions and are subject to change. Actual results may vary materially due to market or other conditions. There is no obligation to update forward-looking information.
Information presented herein comes from reliable third-party sources but is not guaranteed for accuracy or completeness. Rhino Wealth Management, Inc. disclaims liability for errors or omissions. Portions of this content may be generated using advanced analytical tools, including artificial intelligence, and all such content has been reviewed and validated by Todd Van Der Meid, MBA, CFP®, using proprietary quality-control measures. Rhino Wealth Management, Inc. does not directly hold securities; however, securities mentioned may be included within recommended portfolio models or held by clients. Please refer to our Form ADV for additional details regarding potential conflicts of interest.